Gold and oil are splitting, and the NFP report could decide what’s next

Note: As of August 2025, we no longer offer the Deriv X platform.
Gold is nervous. Oil is bleeding. And with the US non-farm payrolls (NFP) report landing, both markets are bracing for impact.
Gold, the go-to safe haven in shaky times, has struggled to shine, dragged down by a dollar that just won’t back off. Oil’s been hit even harder, plunging to a four-year low near $60.
What's behind these slides, and could Friday's critical NFP report turn things around?
Gold still under pressure, but hopeful
Gold’s recent quiet spell can largely be attributed to a strengthening dollar, which makes the precious metal pricier and less attractive for investors holding other currencies. Additionally, recent optimism over easing trade tensions - especially the U.S. administration’s decision to delay auto tariffs by two years - briefly dampened gold's safe-haven appeal, prompting investors to shift towards riskier assets.
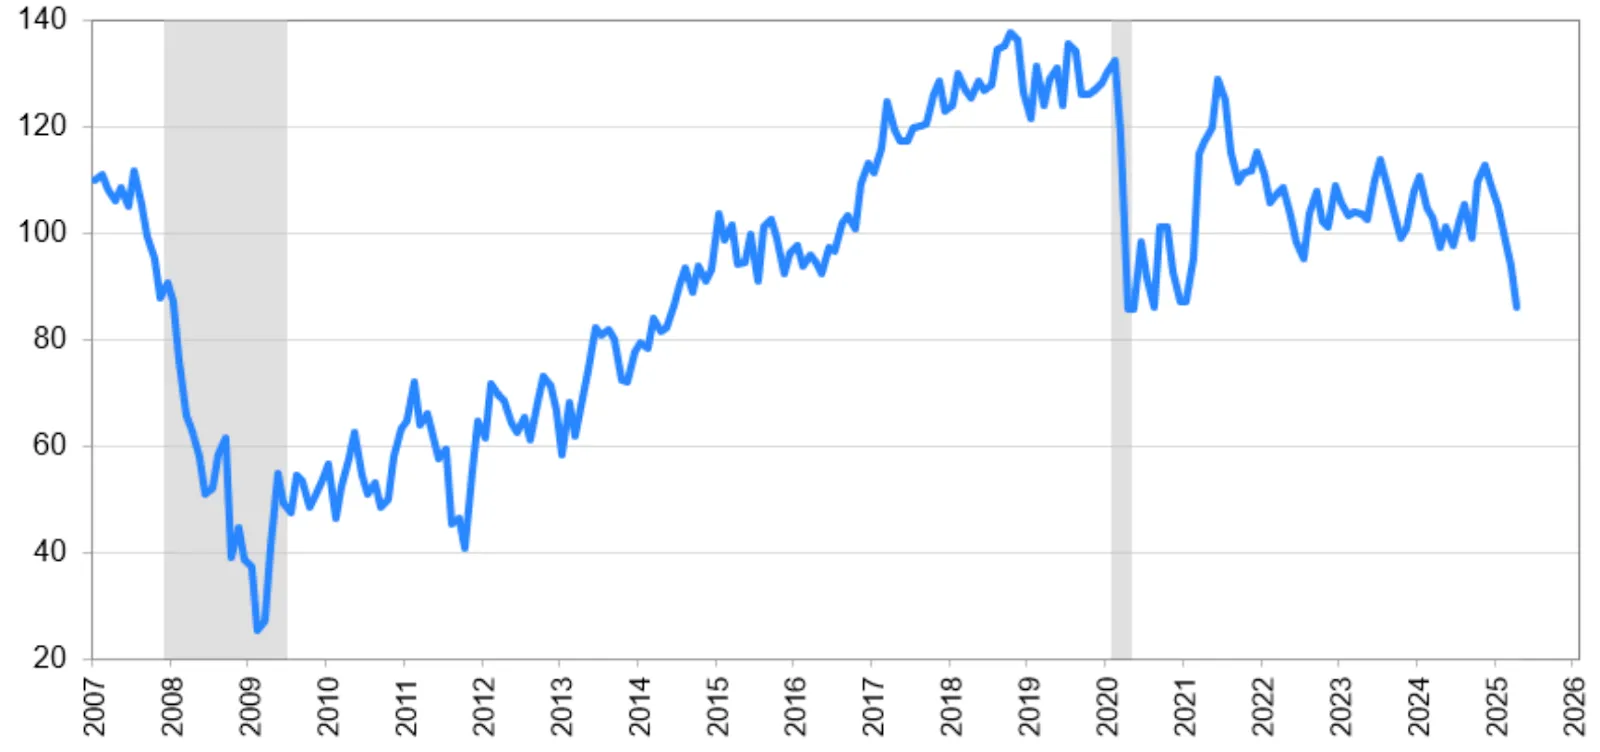
However, gold remains supported by mounting expectations of the Federal Reserve's rate cuts. Economic data has raised red flags: consumer confidence plunged to 86.0, its weakest reading in nearly five years, while U.S. job openings fell to their lowest level since September 2024.
Markets are now pricing in a nearly 60% chance of a Fed rate cut, typically beneficial for non-yielding assets like gold, which thrive during periods of economic uncertainty and low interest rates.

Saudi Arabia's oil strategy shakes up Oil markets
Over in the oil market, Saudi Arabia has shaken things up by shifting its traditional strategy. Usually, the guardian of higher oil prices through production cuts, the kingdom now seems content to tolerate lower prices to regain market share. Frustrated with OPEC+ partners who exceed their quotas, Saudi Arabia is signalling it won't cut supply anytime soon, increasing bearish pressure on prices.
However, oil prices briefly bounced nearly 2% higher recently after President Donald Trump threatened secondary sanctions on Iran, demanding that all purchases of Iranian oil or petrochemical products cease immediately. Trump's move came after the postponement of the fourth round of U.S.-Iran nuclear talks initially scheduled for Saturday.
According to Andrew Lipow of Lipow Oil Associates, enforcing these sanctions could potentially reduce global oil supply by about 1.5 million barrels per day, temporarily supporting prices.
Still, with OPEC+ discussions approaching next week, further output increases seem likely, as several members plan to suggest accelerating production hikes in June. Analysts like Dennis Kissler from BOK Financial warn this could add even more downside risks.
Economic clouds gather
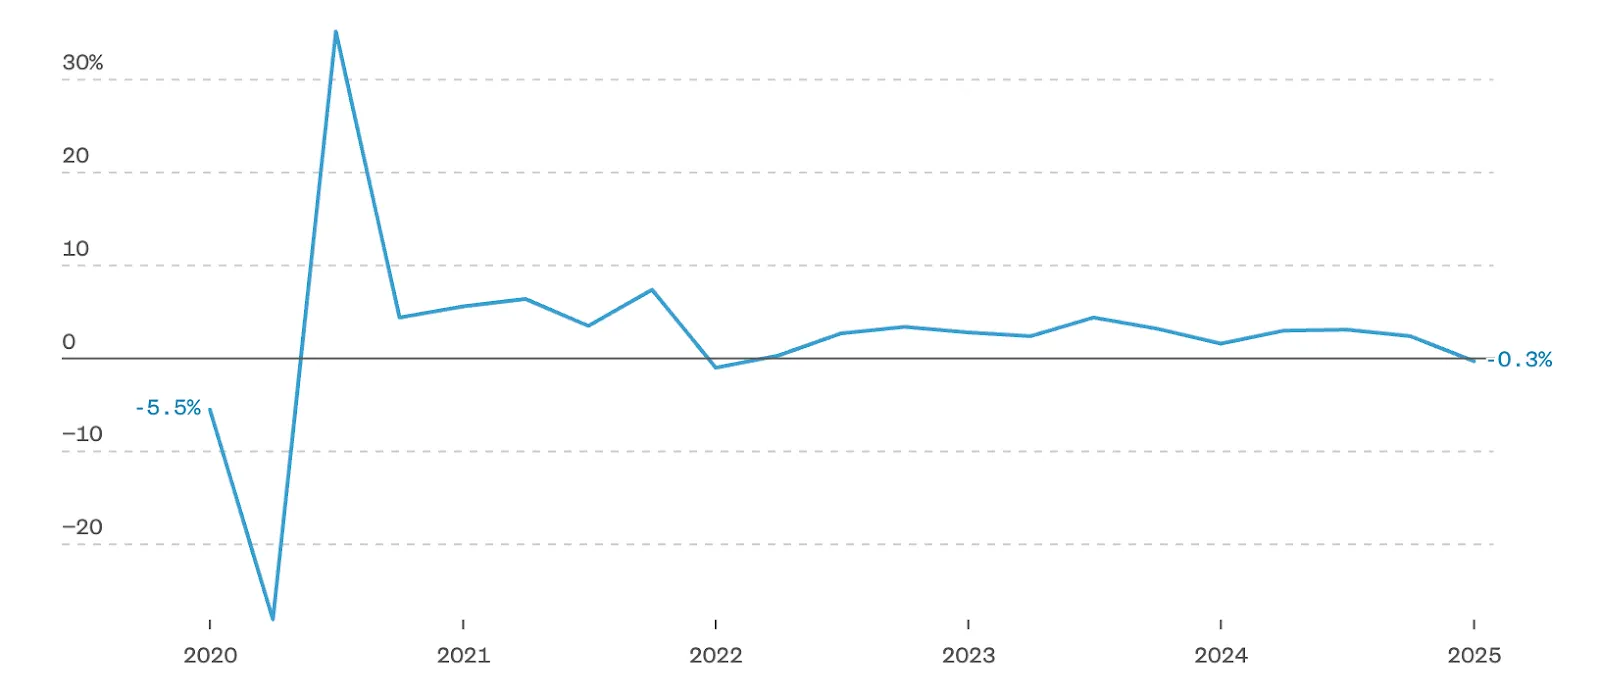
Adding to commodity woes are fears about slowing global economic growth. The U.S. economy contracted unexpectedly in Q1 by 0.3%, driven by heavy import activity ahead of Trump's tariffs. China and Europe are also facing economic slowdowns, dampening global demand for both oil and gold.
All eyes on Non-farm payrolls
The NFP report set for release this Friday could be pivotal. Expectations suggest slower hiring but stable unemployment at 4.2%. A weaker-than-expected report could heighten recession fears, potentially boosting gold prices as investors seek safety. For oil, weak employment data might mean lower demand prospects, but a potential rate cut weakening the dollar could offer short-term support.
Can tech stocks save the day?
Interestingly, solid earnings from tech giants Meta and Microsoft recently boosted investor sentiment, briefly stabilising oil prices and improving overall market confidence. But tech earnings alone probably won't be enough to permanently lift commodities out of their slump.
Commodity market technical analysis
Both gold and oil markets currently feel like they're on uncertain ground, balancing economic fears against potential policy interventions. Hedge funds have reduced bullish bets, and market volatility is rising. With Friday’s payroll numbers around the corner, investors are holding their breath.
Will gold regain its sparkle? Can oil prices stabilise? Keep your eyes peeled - this week’s economic data might just set the tone for commodities in the weeks to come.
Gold price forecast
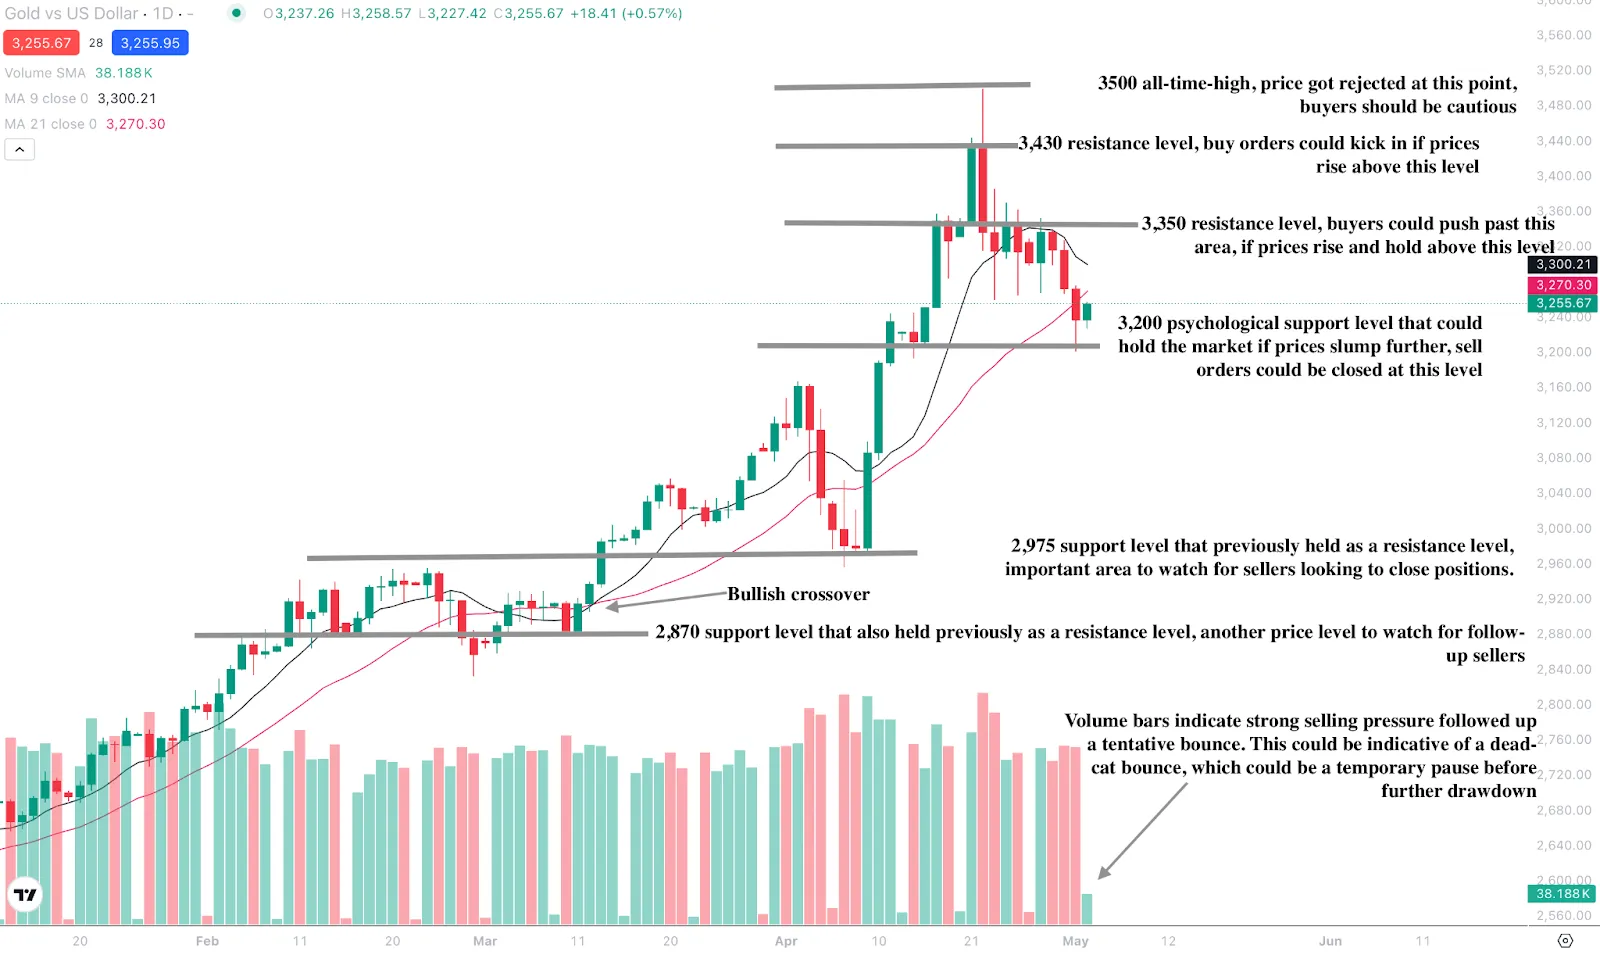
At the time of writing, Gold is seeing a slight uptick after heavy sell pressure. A previous bullish crossover painted a picture of prices within a major uptrend. At the same time, the volume bars indicate a potential dead cat bounce, where we see some follow-up sells. Should prices see further upmoves, we could see resistance at the $3,350, $3,430, and $3,500 resistance levels. Should prices see a slump, prices could find support at the $3,200, $2,975, and $2,870 support levels.
Oil price analysis
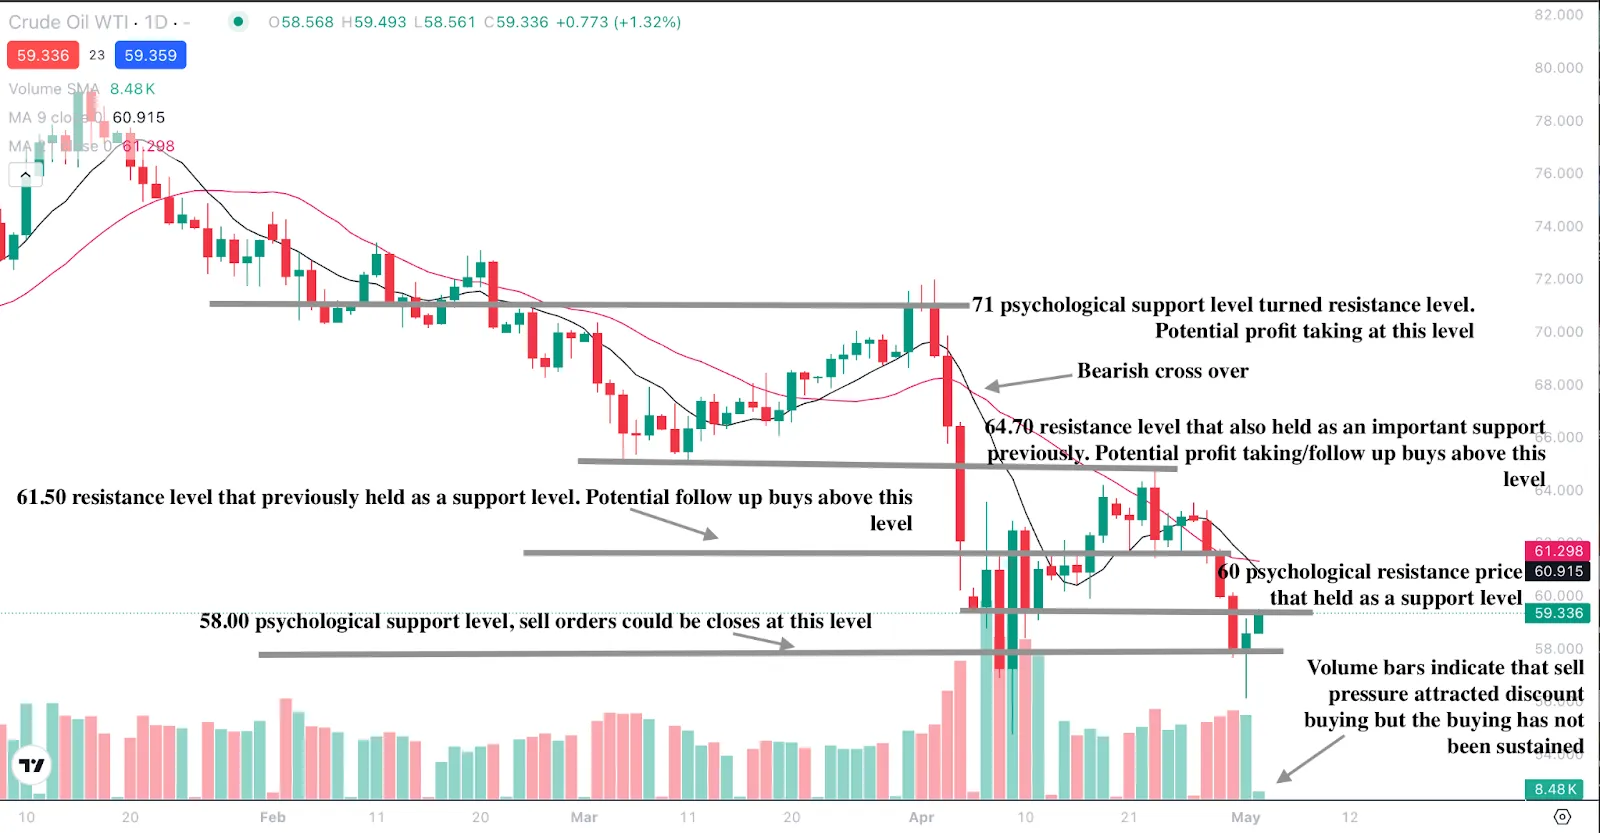
Oil prices, on the other hand, are still touching lows of $60. A previous bearish crossover gave indicators that prices were entering a sell zone, and prices are still in that zone. The bearish narrative is supported further by the volume bullish bars declining – which is indicative of buy pressure declining. Should prices slump, the $58 psychological support level will be an important price to watch. If we see a bounce, prices could encounter resistance at the $61.50, $64.70, and $71.00 resistance levels.
Are you watching commodities in these volatile times? You can speculate on Gold and Oil with a Deriv MT5 or Deriv X account.
Disclaimer:
This content is not intended for EU residents. The information contained within this blog article is for educational purposes only and is not intended as financial or investment advice. The information may become outdated. We recommend you do your own research before making any trading decisions. The performance figures quoted are not a guarantee of future performance.


