A queda de $77.000 do Bitcoin expõe o núcleo frágil do boom das criptomoedas

A queda do Bitcoin abaixo dos $77.000 não foi uma correção rotineira, segundo analistas. Foi um teste de stress – e o mercado falhou. Cerca de 800 mil milhões de dólares em valor terão sido eliminados desde o pico de outubro, perto dos $126.000, empurrando o Bitcoin para fora do top 10 global de ativos e desencadeando mais de 2,5 mil milhões de dólares em liquidações forçadas num único dia.
Este movimento é relevante porque revela em que se baseava este bull market: alavancagem, liquidez reduzida e a suposição de que compradores estariam sempre presentes. Quando o risco geopolítico aumentou e o dólar se fortaleceu, essa suposição colapsou. O que se seguiu não foi uma compra em pânico ou uma rotação para ativos de refúgio, mas algo mais corrosivo – uma ausência de procura.
O que está a impulsionar a queda do Bitcoin?
O catalisador imediato foi o risco geopolítico. Relatos de tensões crescentes entre os Estados Unidos e o Irão congelaram o apetite pelo risco e desencadearam uma corrida por liquidez em dólares. Em teoria, seria aqui que a narrativa do Bitcoin como “ouro digital” deveria ter-se afirmado. Em vez disso, o Bitcoin comportou-se como um canal de liquidez, sendo vendido agressivamente à medida que os traders procuravam liquidez durante condições de mercado reduzidas ao fim de semana.
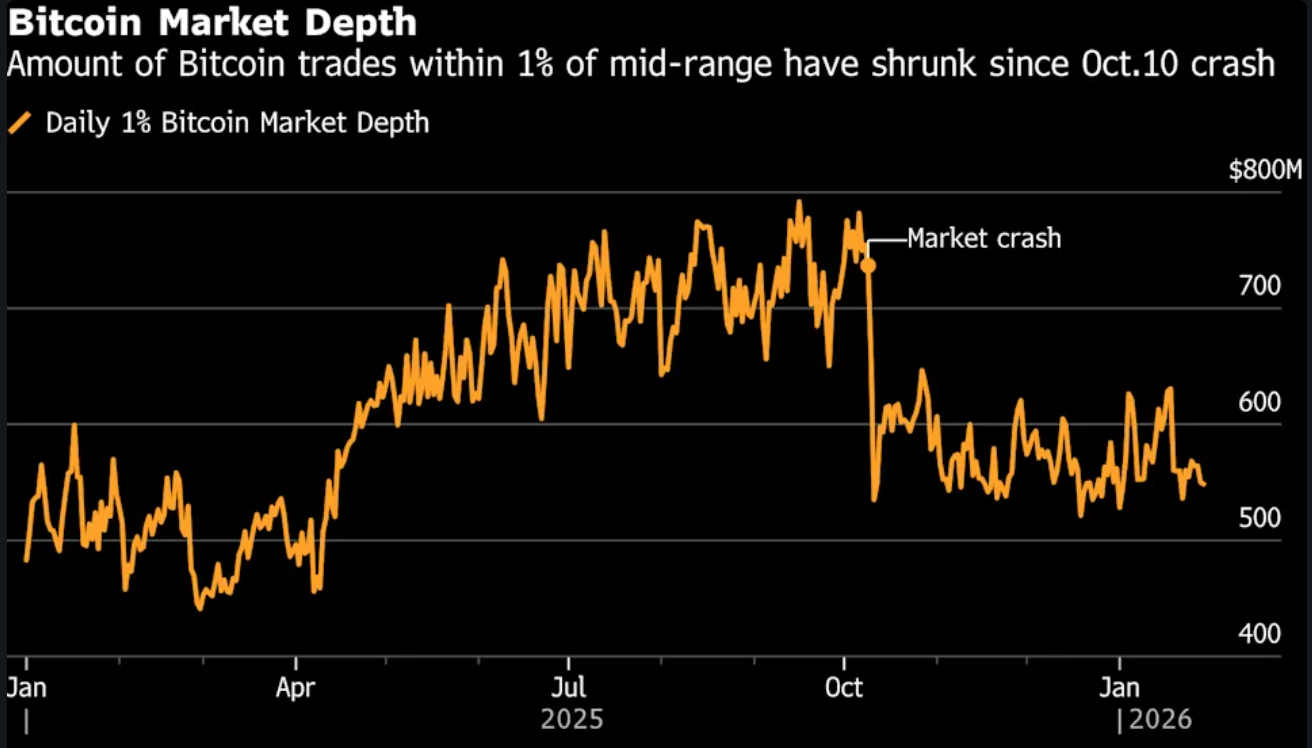
Essa resposta não foi acidental. O Bitcoin é negociado continuamente, tem uma forte exposição a derivados e está profundamente integrado na gestão de risco entre ativos. Quando a volatilidade dispara noutros mercados, as criptomoedas são frequentemente o primeiro ativo a ser vendido. Desta vez, o efeito foi amplificado pela fraca profundidade de mercado.
Segundo a Kaiko, a liquidez do Bitcoin permanece mais de 30% abaixo do pico de outubro, um nível anteriormente visto apenas após o colapso da FTX em 2022.
O segundo fator foi a reprecificação macroeconómica. A nomeação de Kevin Warsh para liderar a Federal Reserve desencadeou uma forte valorização do dólar americano, forçando uma reavaliação generalizada dos ativos de risco.
Na sexta-feira, 30 de janeiro, o ouro caiu quase 9% numa única sessão. A prata desvalorizou mais de 25%. O Bitcoin não se descolou – acompanhou. O resultado foi uma redução generalizada das posições em “hard money”, à medida que a força do dólar afastou compradores marginais.
Porque é que isto importa
Observadores do mercado notaram que esta venda desafia a base do mais recente boom das criptomoedas. O Bitcoin foi promovido como proteção contra a inflação, desvalorização cambial e stress geopolítico. Na última semana, falhou nos três testes. Em vez de atrair fluxos defensivos, foi tratado como um ativo volátil e alavancado cuja principal função era gerar liquidez.
O dano psicológico pode ser mais importante do que a própria queda de preço. “Isto não é capitulação no sentido tradicional”, disse Paul Howard, diretor da market maker Wincent. “É uma falta de urgência em comprar. Quando a convicção desaparece, os preços não precisam de um choque para cair – descem por si só”. Esta distinção é importante porque os mercados recuperam rapidamente do pânico. Recuperam muito mais lentamente da indiferença.
Impacto nos mercados cripto e investidores
O dano mecânico foi severo. Quase 200.000 traders foram liquidados durante o fim de semana, à medida que posições long alavancadas foram automaticamente encerradas, criando uma venda auto-reforçada. Assim que níveis-chave foram ultrapassados, a descoberta de preços passou a ser dominada por vendas forçadas em vez de negociações discricionárias.
Os investidores de retalho foram os mais afetados. Dados on-chain mostram que detentores com menos de 10 BTC têm sido vendedores líquidos consistentes há mais de um mês. Muitos entraram tarde no rally e agora enfrentam perdas superiores a 30%. Em contraste, os “mega-whales” com mais de 1.000 BTC acumularam discretamente, absorvendo oferta sem impulsionar os preços.
A procura institucional também enfraqueceu. Os ETFs de Bitcoin spot continuam a registar saídas líquidas, sugerindo uma convicção mais fraca entre investidores institucionais que compraram perto dos máximos. Empresas de tesouraria de ativos digitais, outrora compradores fiáveis, abrandaram as compras após o colapso das suas próprias avaliações de capital no ano passado, removendo um pilar-chave da procura.
Perspetiva dos especialistas
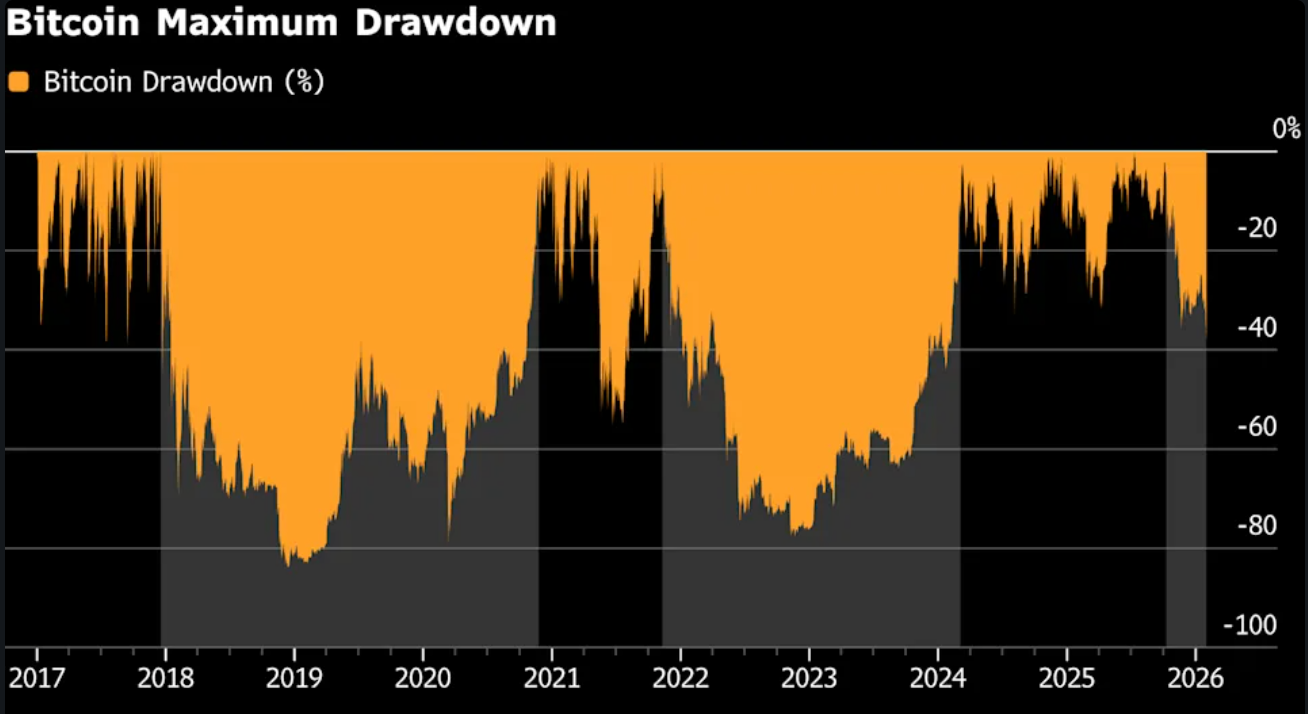
Os analistas veem cada vez mais esta queda como cíclica e não tática. Laurens Fraussen, da Kaiko, observa que os anteriores “invernos cripto” foram definidos por uma contração prolongada dos volumes. Após o pico de 2017, os volumes spot caíram entre 60% e 70%. A correção de 2021–2023 registou uma queda menor, mas ainda dolorosa, de 30% a 40%. Os dados atuais sugerem que o mercado pode estar apenas a um quarto do caminho deste ciclo.
Outros alertam que o Bitcoin enfrenta agora concorrência real pelo capital. Richard Hodges, fundador do Ferro BTC Volatility Fund, argumenta que a atenção se deslocou para outros ativos. “As ações ligadas à IA e os metais preciosos estão a captar os traders de momentum”, afirmou. “O Bitcoin parece uma história antiga. Não espero um novo máximo histórico durante pelo menos 1.000 dias”.
A história oferece pouco conforto. Após o pico de 2021, o Bitcoin demorou 28 meses a recuperar. Depois do boom de 2017, passaram quase três anos até um novo máximo. Por esses padrões, o tempo – e não o preço – pode ser o maior desafio do mercado.
Conclusão principal
A queda do Bitcoin para $77.000 não expôs pânico – expôs fragilidade. Analistas expressaram que este bull market dependia de alavancagem, momentum e da crença de que compradores estariam sempre presentes. Quando a liquidez desapareceu, essa crença também se evaporou. A próxima fase dependerá menos das manchetes e mais de saber se convicção, volume e procura real regressam em conjunto.
Perspetiva técnica do Bitcoin
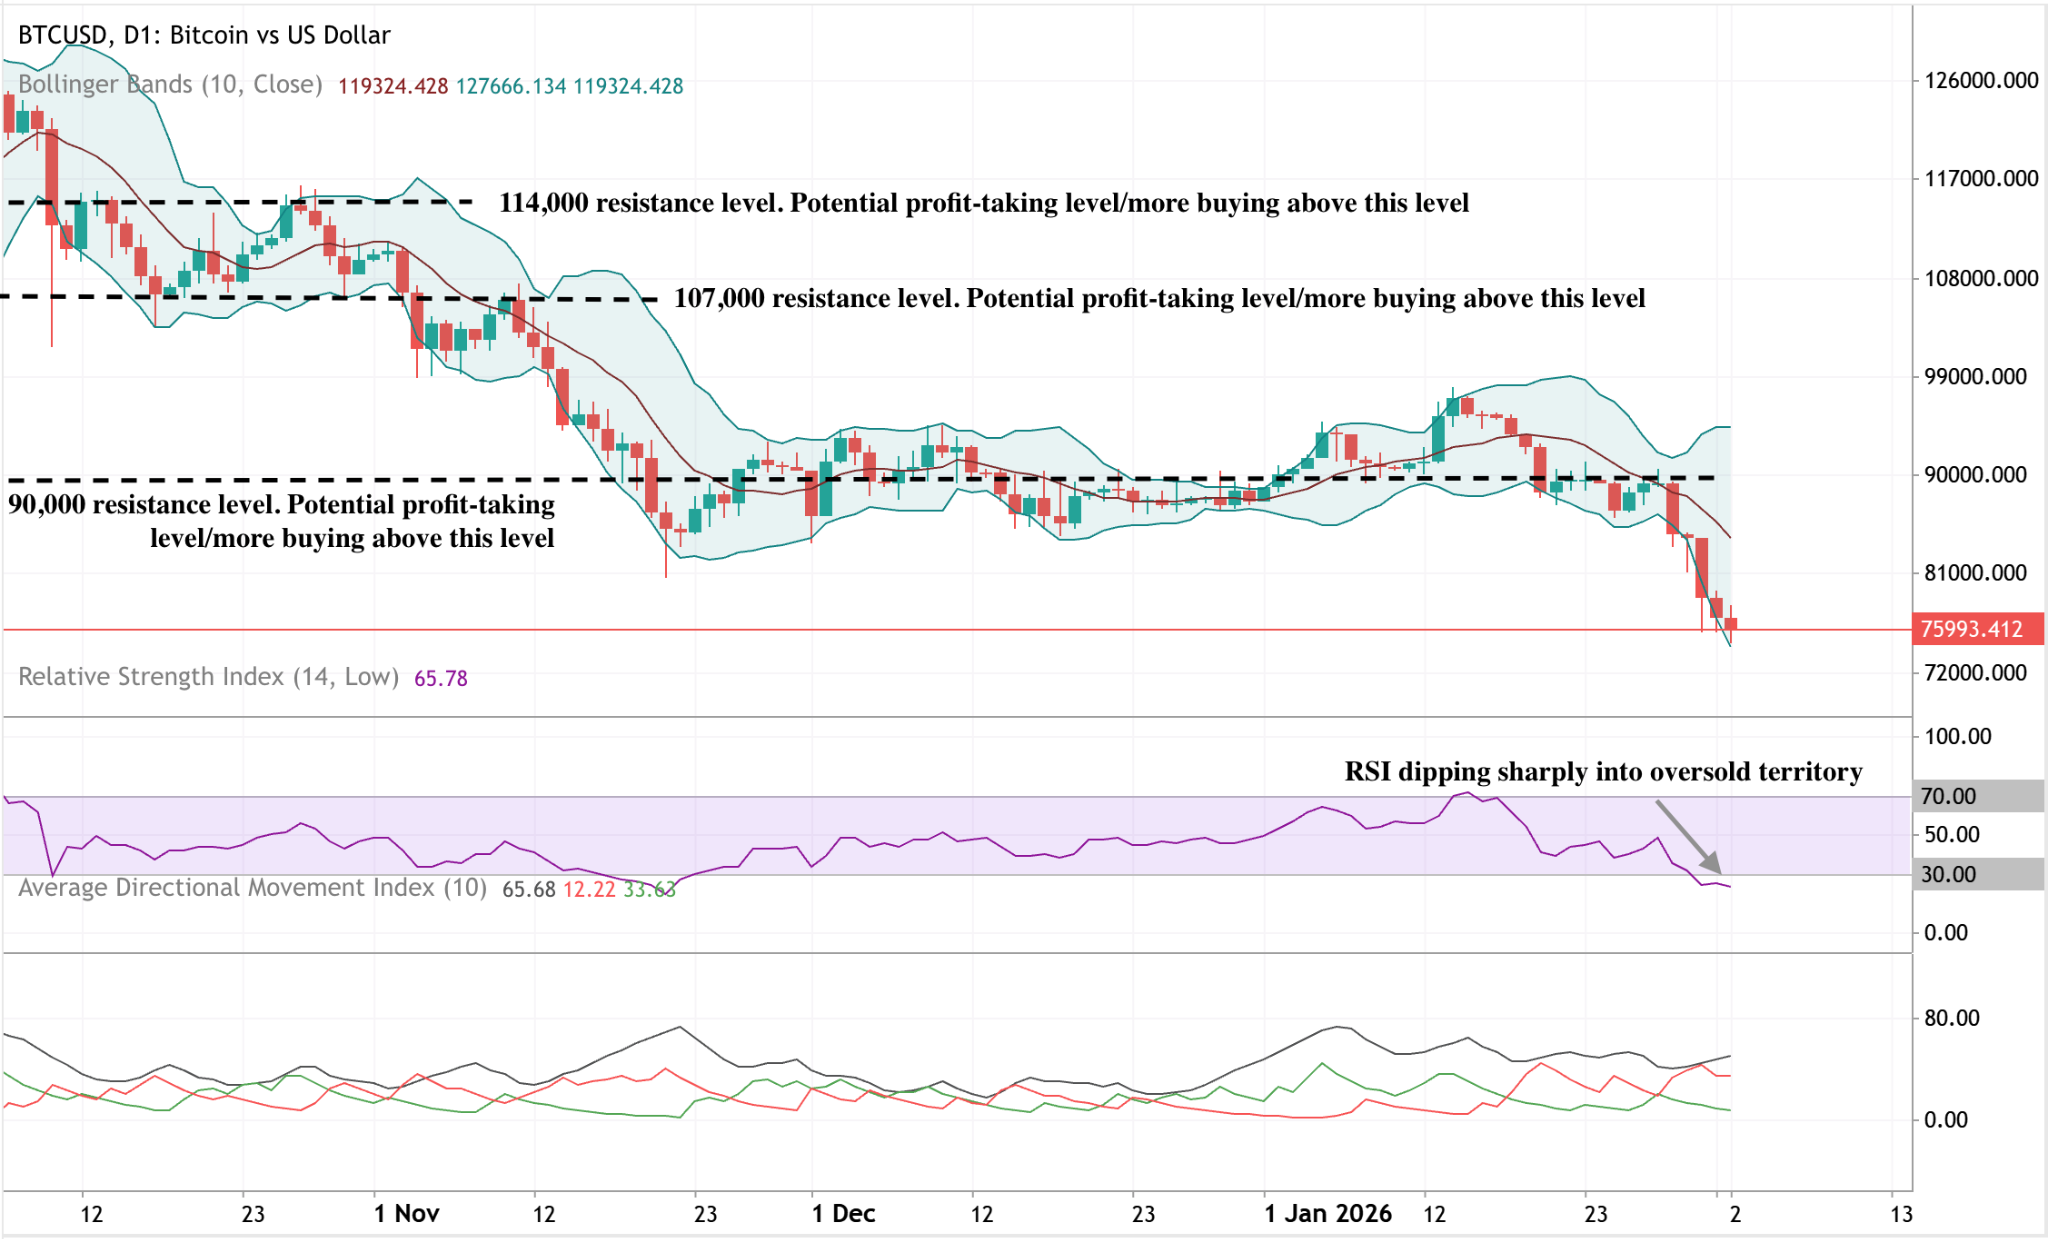
O Bitcoin caiu acentuadamente a partir da sua recente zona de consolidação, aproximando-se do limite inferior da sua estrutura de preços mais ampla. O preço está a negociar perto da Banda de Bollinger inferior, enquanto as próprias bandas permanecem expandidas, indicando volatilidade elevada após a recente aceleração descendente.
Os indicadores de momentum refletem a intensidade do movimento: o RSI caiu de forma decisiva para território de sobrevenda, sinalizando uma deterioração acentuada do momentum de curto prazo, em vez de um declínio gradual. A força da tendência mantém-se elevada, com leituras de ADX ainda altas, sugerindo que o ambiente de tendência mais ampla permanece ativo, mesmo com a mudança de direção.
Em termos estruturais, o preço quebrou abaixo da zona de consolidação anteriormente observada em torno dos $90.000, com áreas de resistência anteriores perto dos $107.000 e $114.000 agora bem acima dos níveis atuais.
Os resultados apresentados não garantem desempenhos futuros.


