Pourquoi une légende de Wall Street affirme que les prix sont « presque garantis » de chuter de 50 % tandis que Citi vise 150 $

L’argent n’a pas seulement progressé, il a explosé, bondissant de près de 3x en un an et franchissant la barre des 100 $/oz, alors même que l’un des stratèges les plus célèbres de Wall Street avertit que le métal est « presque garanti » de chuter d’environ 50 % à partir d’ici. L’ancien stratège en chef de JPMorgan, Marko Kolanovic, estime que la hausse parabolique de l’argent est un exemple classique de bulle spéculative.
À quel point la hausse de l’argent est-elle extrême ?
Au cours de l’année écoulée, l’argent est passé de la zone des 30 $ à des sommets historiques en séance autour de 115–118 $ l’once, offrant un gain d’environ 250–270 % et surpassant l’or ainsi que la plupart des grands indices boursiers.
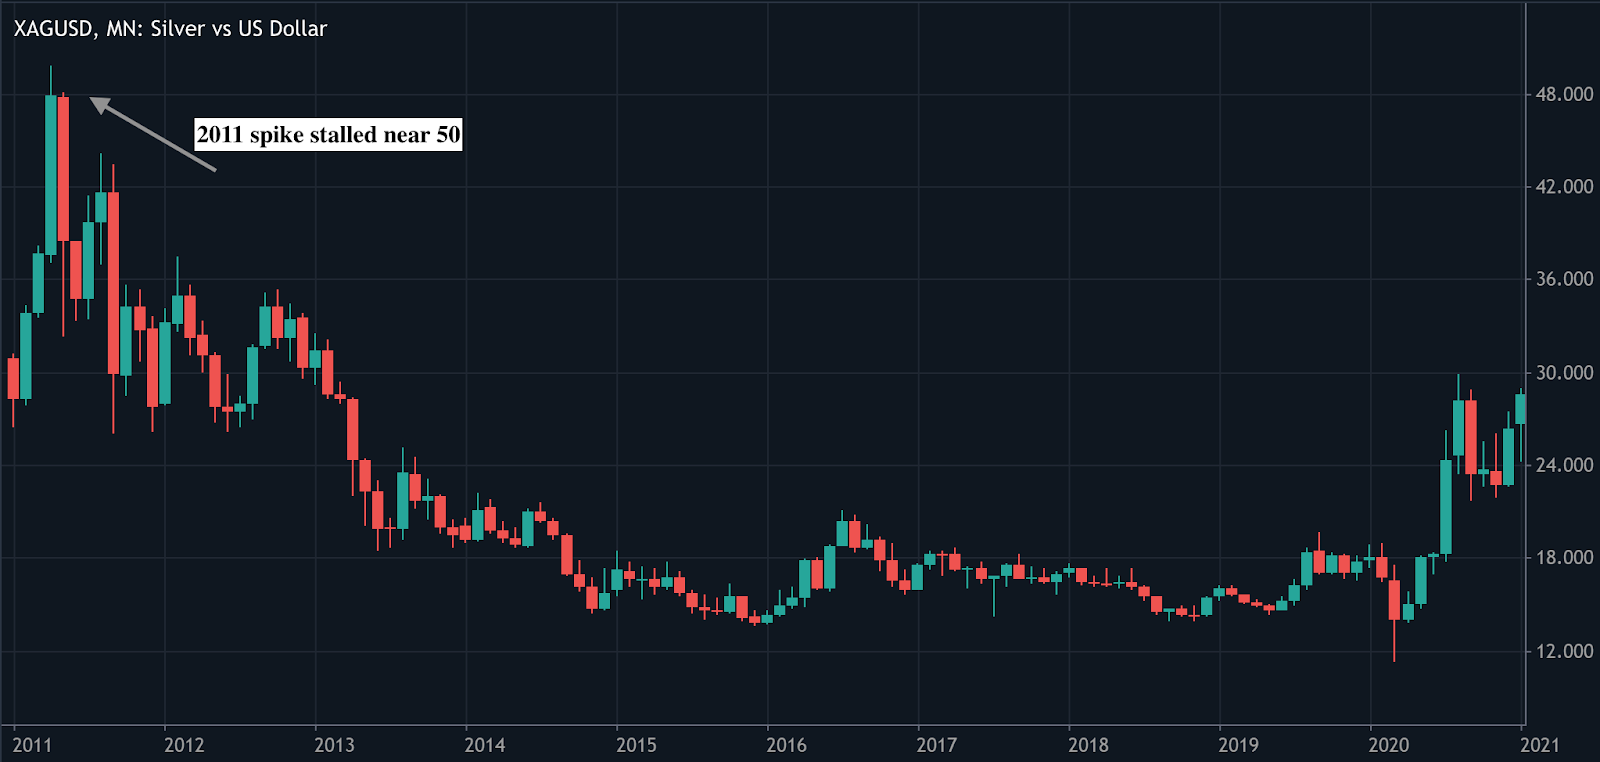
Citi note que cette envolée a déjà propulsé l’argent à un record historique en séance près de 117,7 $, comprimant le ratio or/argent sous 50 et soulignant à quel point la dynamique s’est brutalement inversée en faveur de l’argent. Pour rappel, la dernière grande flambée en 2011 s’était arrêtée près de 50 $ avant un marché baissier prolongé, ce qui rend le niveau de prix actuel sans précédent en valeur nominale.
Les analystes notent que ce mouvement a transformé l’argent, autrefois métal précieux discret, en un actif de momentum qui fait la une, avec des variations intrajournalières à deux chiffres. Une telle volatilité est typique des phases finales des booms de matières premières, où les flux marginaux et le sentiment, et non les fondamentaux lents, dominent l’évolution des prix.
Le scénario baissier : le krach de 50 % « presque garanti » selon Kolanovic
L’avertissement de Kolanovic est sans détour : il affirme que l’argent est « presque garanti de chuter d’environ 50 % depuis ces niveaux d’ici un an environ », arguant que la flambée actuelle porte tous les signes d’une bulle spéculative.
Il pointe l’achat sur momentum, les comportements de trading façon « meme » et les positions macro de peur comme moteurs principaux, plutôt qu’une amélioration durable des fondamentaux sous-jacents. Selon lui, l’argent se négocie moins comme une valeur refuge traditionnelle et davantage comme un instrument macro à effet de levier, susceptible de déraper violemment dans les deux sens.
La logique s’appuie sur l’histoire : les matières premières qui deviennent paraboliques plafonnent rarement en douceur ; elles ont tendance à revenir brutalement à la moyenne lorsque les positions se défont et que les acheteurs marginaux disparaissent. Le krach de l’argent en 2011 et les cycles boom-bust des années 1970 sont souvent cités comme exemples où de fortes corrections ont suivi des pics euphoriques, sans pour autant mettre fin aux tendances séculaires de long terme.
Kolanovic souligne que, contrairement aux actifs purement fictifs, les bulles sur les matières premières finissent par se heurter à la réalité physique : des prix élevés détruisent la demande industrielle, accélèrent le recyclage et incitent à l’arrivée de nouvelles offres couvertes.
Le scénario haussier : l’objectif de 150 $ de Citi et « l’or sous stéroïdes »
À l’inverse, l’équipe matières premières de Citi est devenue tactiquement plus haussière, relevant son objectif de prix de l’argent à 0–3 mois à 150 $ l’once, ce qui implique encore 30–40 % de potentiel de hausse par rapport aux niveaux récents. Maximilian Layton de Citi écrit : « Nous restons tactiquement haussiers et relevons notre objectif de prix à 0–3 mois à 150 $/oz », qualifiant le comportement actuel de l’argent de « gold squared » ou « or sous stéroïdes » alors que les flux de capitaux recherchent des couvertures macro.
La banque estime que la hausse est principalement alimentée par les flux de capitaux et la demande spéculative plutôt que par les fondamentaux traditionnels, mais pense que ces flux ont encore de la marge avant que le marché ne paraisse cher par rapport à l’or.
Citi met en avant trois soutiens principaux : des risques géopolitiques accrus, des inquiétudes renouvelées sur l’indépendance de la Federal Reserve, et une forte demande d’investissement et spéculative menée par les investisseurs chinois et asiatiques.
Les rapports indiquent que l’offre physique hors États-Unis semble tendue, avec des primes élevées sur les marchés clés et des déficits persistants attendus dans les années à venir. Dans ce contexte, l’argent devrait continuer à s’envoler avant toute normalisation majeure, surtout si les flux de détail suiveurs de tendance en Chine et ailleurs continuent d’affluer sur le marché.
Demande industrielle, solaire et risque de substitution
Sous la mousse spéculative, l’argent reste un métal industriel de base : les applications industrielles représentent désormais environ 58 % de la demande mondiale d’argent, avec des usages clés dans les énergies renouvelables, l’électronique et l’automobile.
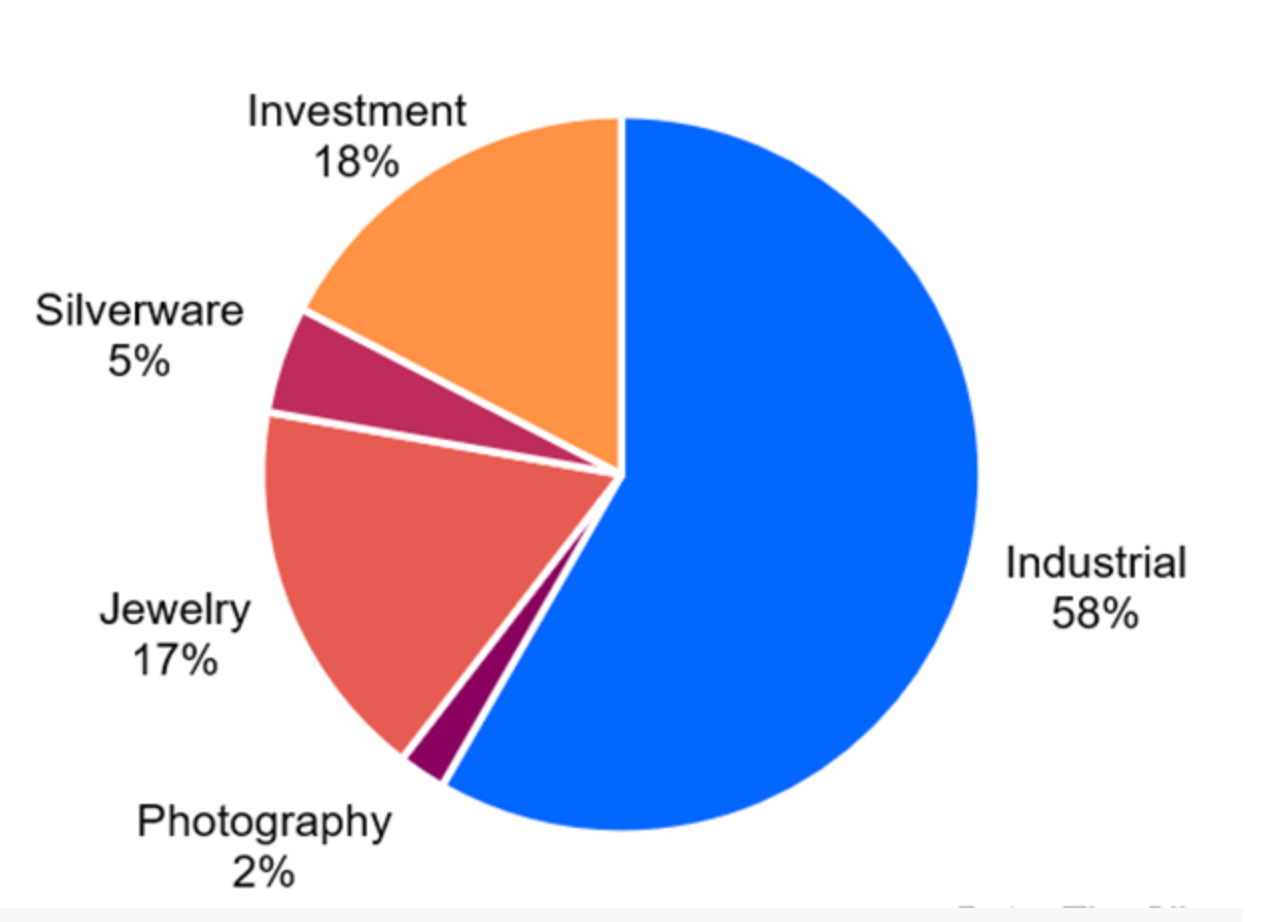
Le Silver Institute et Metals Focus prévoient une demande industrielle d’environ 700 millions d’onces, tirée en grande partie par le photovoltaïque, où la conductivité de l’argent le rend essentiel pour les cellules solaires. Les estimations récentes suggèrent que le solaire pourrait représenter à lui seul environ 19–20 % de la demande totale d’argent en 2024, soit environ 230 millions d’onces, et que la demande solaire a presque doublé par rapport à 2022.
Dans le même temps, les prix élevés accélèrent déjà la « sobriété argent » et la substitution par des métaux de base moins chers dans certaines applications. Les rapports industriels décrivent des fabricants de modules majeurs comme LONGi cherchant à réduire la quantité d’argent dans leurs cellules solaires, explorant la métallisation à base de cuivre et d’autres innovations pour limiter l’exposition aux coûts.
Cela crée une tension : une offre structurellement tendue et une demande verte en plein essor soutiennent le scénario haussier, mais des prix très élevés préparent aussi le terrain à une future destruction de la demande et à la substitution : c’est exactement la dynamique que Kolanovic met en garde.
Positionnement, ETF, Chine et le nouveau trade momentum
Ce rallye de l’argent diffère des cycles précédents car le centre de gravité spéculatif se situe ailleurs. Citi observe que plusieurs signaux historiquement baissiers – comme la baisse des avoirs mondiaux en ETF argent et le recul des positions sur le COMEX – n’ont pas freiné la hausse des prix, ce qui indique que l’essentiel des achats provient des marchés à terme et OTC asiatiques plutôt que des ETF occidentaux.
Les analyses relèvent que les traders de détail chinois ont joué un rôle clé, poussant les autorités à durcir les conditions, notamment en relevant les marges sur les contrats à terme et en limitant les nouvelles souscriptions à un grand ETF argent domestique.
Les véhicules occidentaux comme iShares Silver Trust, Aberdeen Standard Physical Silver et Sprott Physical Silver Trust restent des portes d’entrée importantes pour les investisseurs macro et particuliers, mais ils ne semblent plus être les principaux moteurs marginaux de cette dernière phase de hausse.
L’avertissement de Kolanovic présente explicitement les ETF argent comme des trades macro surpeuplés, exposés à un risque de débouclage brutal, tandis que des produits baissiers axés sur les ETF ont émergé pour permettre aux investisseurs de se positionner contre ce que certains qualifient de « manie parabolique ». Les deux camps, haussier et baissier, s’accordent implicitement sur un point crucial : le positionnement est extrême, et tout changement de flux pourrait entraîner des mouvements très importants dans un sens comme dans l’autre sur une courte période.
Ce qu’une correction de 50 % ou un pic à 150 $ pourrait signifier
Les observateurs du marché notent que si Kolanovic a raison et que l’argent se négocie à environ la moitié de son prix récent d’ici fin 2026, un passage de 110–115 $ à la zone des 50–60 $ infligerait de lourdes pertes aux acheteurs de fin de cycle, aux traders à effet de levier et aux producteurs à coûts élevés. Une telle correction serait douloureuse mais pas sans précédent historique, si l’on se réfère aux précédents krachs de l’argent et d’autres matières premières. Elle pourrait aussi soulager la pression sur les utilisateurs industriels et accélérer un rééquilibrage où la sobriété et la substitution ralentissent, la demande se stabilise et le métal pose potentiellement les bases d’une nouvelle jambe haussière séculaire.
Si le scénario haussier tactique de Citi se réalise, un pic à 150 $ comprimerait encore le ratio or/argent et consacrerait l’argent comme l’expression à bêta élevé de la peur macro et de la liquidité.
Cependant, de tels niveaux intensifieraient probablement les réponses politiques sur les marchés clés – via un durcissement des règles de marge, des restrictions sur l’accès spéculatif ou d’autres mesures – et accéléreraient les efforts dans le solaire et l’électronique pour éliminer l’argent d’un maximum d’applications. Citi elle-même prévient que, même si l’équilibre offre-demande à moyen-long terme reste tendu, la volatilité à court terme pourrait augmenter après une telle envolée.
À retenir
L’argent se trouve désormais à un point d’inflexion entre momentum et retour à la moyenne. D’un côté, Citi voit de puissants flux macro, une offre physique tendue et une demande spéculative pouvant pousser les prix jusqu’à 150 $ à court terme. De l’autre, Marko Kolanovic avertit que l’histoire est rarement clémente avec les mouvements paraboliques des matières premières, une correction de 50 % étant un scénario familier une fois que les positions se défont et que les prix élevés commencent à détruire la demande.
Pour les traders et investisseurs, le message est clair : l’argent a peut-être encore du potentiel, mais il n’est plus une couverture tranquille contre l’inflation – c’est un trade macro à forte volatilité et forte conviction où le timing et la gestion du risque comptent plus que jamais.
Perspectives techniques sur l’argent
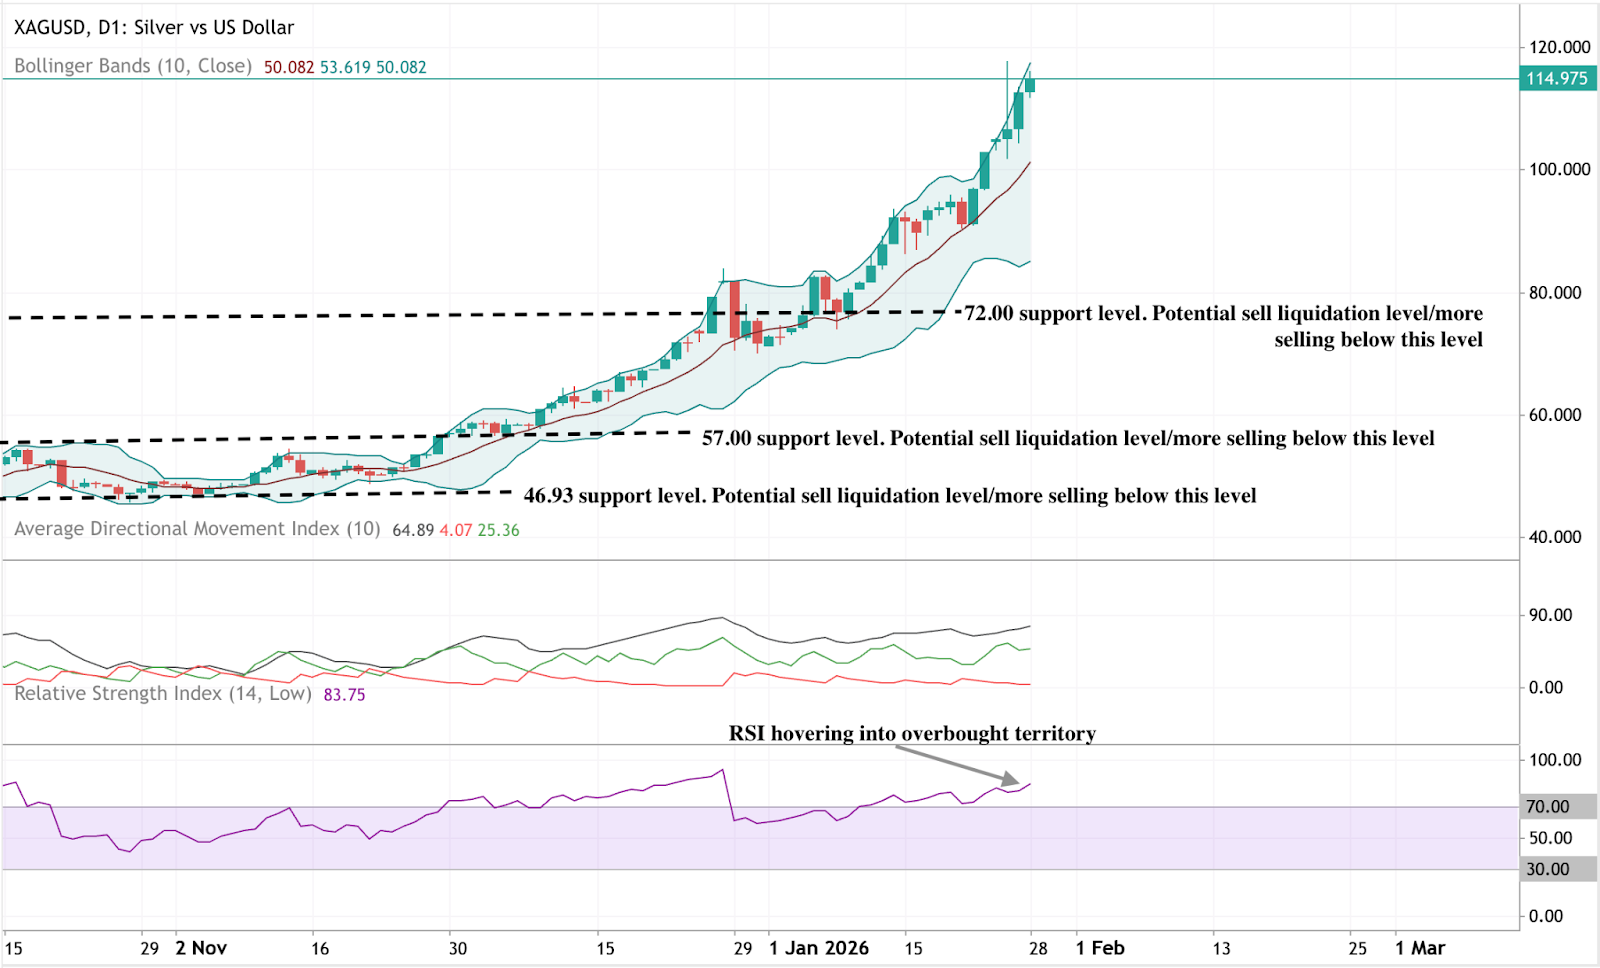
L’argent continue d’évoluer à la hausse vers de nouveaux territoires de prix, suivant la bande supérieure de Bollinger alors que la volatilité reste élevée. Les Bandes de Bollinger sont largement écartées, signalant un environnement de forte volatilité durable après l’accélération récente.
Les indicateurs de momentum affichent des niveaux extrêmes, avec le RSI en zone de surachat et l’ADX à des niveaux élevés, reflétant une phase de tendance forte et mature. D’un point de vue structurel, les prix actuels se situent bien au-dessus des anciennes zones de consolidation autour de 72 $, 57 $ et 46,93 $, illustrant l’ampleur du mouvement récent.
Les performances passées ne préjugent pas des performances futures.


