Perché una leggenda di Wall Street afferma che i prezzi sono ‘quasi garantiti’ a scendere del 50% mentre Citi punta a $150

L’argento non si è solo rafforzato, è letteralmente esploso, triplicando quasi in un anno e superando i $100/oncia, anche se uno degli strateghi più famosi di Wall Street avverte che il metallo è “quasi garantito” a scendere di circa il 50% da qui. L’ex chief strategist di JPMorgan, Marko Kolanovic, afferma che il movimento parabolico dell’argento è un classico esempio di bolla speculativa.
Quanto è estrema la corsa dell’argento?
Nell’ultimo anno, l’argento è passato dai bassi 30 dollari a massimi intraday record intorno a $115–$118 per oncia, offrendo un guadagno di circa il 250–270% e superando oro e la maggior parte dei principali indici azionari.
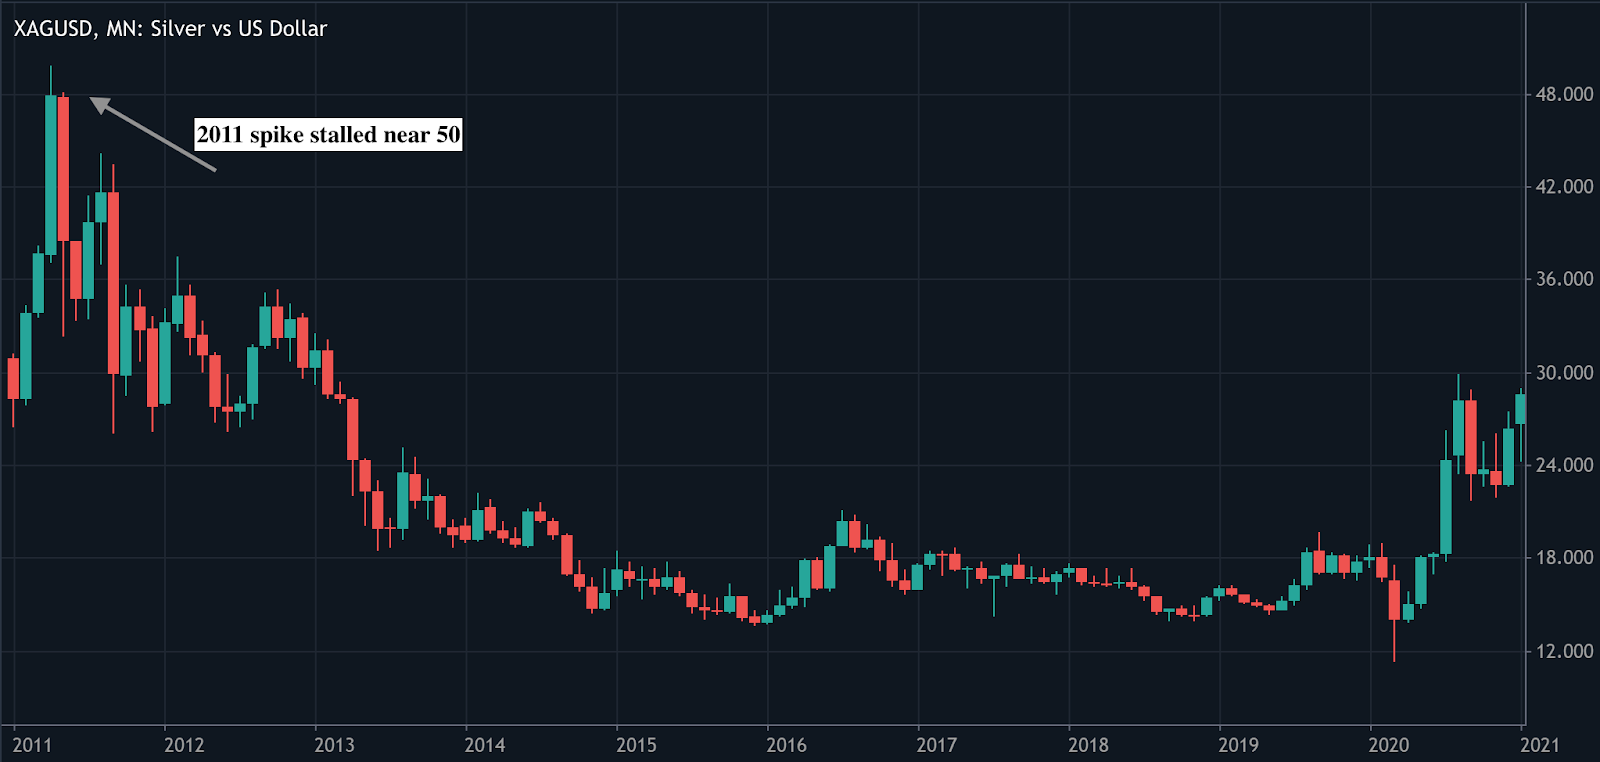
Citi osserva che l’impennata ha già portato l’argento a un massimo intraday storico vicino a $117,7, comprimendo il rapporto oro/argento sotto 50 e sottolineando quanto violentemente il trade si sia spostato a favore dell’argento. Per contestualizzare, l’ultimo grande picco nel 2011 si fermò vicino a $50 prima di un lungo mercato ribassista pluriennale, rendendo il livello attuale di prezzo senza precedenti in termini nominali.
Gli analisti notano che questo movimento ha trasformato l’argento da metallo prezioso “dormiente” ad asset di momentum da prima pagina, con oscillazioni intraday a doppia cifra percentuale. Tale volatilità è tipica delle fasi finali dei boom delle materie prime, dove a dominare l’azione dei prezzi sono i flussi marginali e il sentiment, non i fondamentali lenti.
Lo scenario ribassista: il crollo “quasi garantito” del 50% secondo Kolanovic
L’avvertimento di Kolanovic è diretto: afferma che l’argento è “quasi garantito a scendere di circa il 50% da questi livelli entro un anno circa”, sostenendo che l’attuale impennata presenta tutte le caratteristiche di una bolla speculativa.
Indica come fattori chiave l’acquisto guidato dal momentum, il comportamento di trading in stile meme e il posizionamento macro dettato dalla paura, piuttosto che miglioramenti duraturi nei fondamentali sottostanti. Secondo lui, l’argento si comporta meno come un tradizionale bene rifugio e più come uno strumento macro con leva che può eccedere violentemente in entrambe le direzioni.
La logica si basa sulla storia: le materie prime che diventano paraboliche raramente si stabilizzano dolcemente; tendono invece a tornare bruscamente verso la media quando il posizionamento si riduce e gli acquirenti marginali scompaiono. Il crollo dell’argento nel 2011 e i cicli boom-bust degli anni ’70 sono spesso citati come esempi in cui forti ribassi hanno seguito picchi euforici senza necessariamente interrompere i temi secolari di lungo periodo.
Kolanovic sottolinea che, a differenza degli asset puramente fittizi, le bolle sulle materie prime alla fine si scontrano con la realtà fisica, poiché prezzi elevati distruggono la domanda industriale, accelerano il riciclo e incentivano nuova offerta coperta.
Lo scenario rialzista: il target di $150 di Citi e “oro potenziato”
Dall’altra parte, il team commodities di Citi è diventato tatticamente più rialzista, alzando il target di prezzo dell’argento a 0–3 mesi a $150 per oncia, il che implica un ulteriore rialzo del 30–40% rispetto ai livelli recenti. Maximilian Layton di Citi scrive: “Restiamo tatticamente rialzisti e aggiorniamo il nostro target di prezzo a 0–3 mesi a $150/oncia”, descrivendo il comportamento attuale dell’argento come “oro al quadrato” o “oro potenziato” mentre i flussi di capitale cercano coperture macro.
La banca sostiene che il rally sia guidato principalmente dai flussi di capitale e dalla domanda speculativa piuttosto che dai fondamentali tradizionali, ma ritiene che tali flussi abbiano ancora spazio per crescere prima che il mercato appaia caro rispetto all’oro.
Citi evidenzia tre principali fattori di supporto: rischi geopolitici elevati, rinnovate preoccupazioni sull’indipendenza della Federal Reserve e forte domanda d’investimento e speculativa guidata da investitori cinesi e di altri paesi asiatici.
Secondo le analisi, l’offerta fisica al di fuori degli Stati Uniti appare limitata, con alti premi nei mercati chiave e deficit persistenti previsti nei prossimi anni. In questo scenario, si prevede che l’argento possa eccedere ulteriormente verso l’alto prima di una normalizzazione significativa, soprattutto se i flussi retail trend-following in Cina e altrove continueranno a riversarsi sul trade.
Domanda industriale, solare e rischio di sostituzione
Sotto la schiuma speculativa, l’argento resta un metallo industriale fondamentale: le applicazioni industriali rappresentano ora circa il 58% della domanda globale di argento, con energia rinnovabile, elettronica e automotive particolarmente rilevanti.
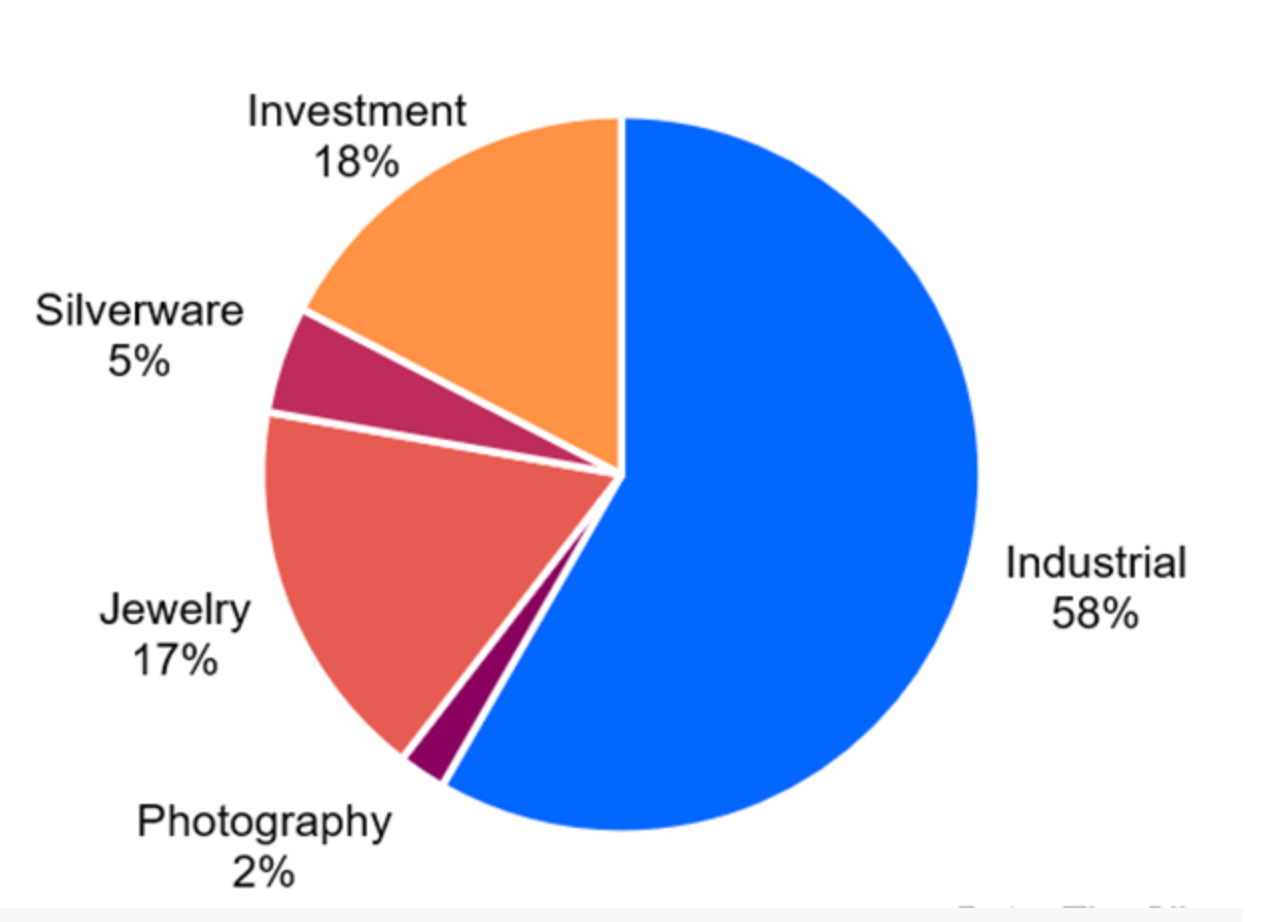
Il Silver Institute e Metals Focus prevedono che la domanda industriale raggiungerà circa 700 milioni di once, trainata in gran parte dal fotovoltaico, dove la conducibilità dell’argento lo rende fondamentale per le celle solari. Stime recenti suggeriscono che il solo settore solare potrebbe rappresentare circa il 19–20% della domanda totale di argento nel 2024, ovvero circa 230 milioni di once, e che la domanda solare sia quasi raddoppiata rispetto al 2022.
Allo stesso tempo, i prezzi elevati stanno già accelerando il “risparmio d’argento” e la sostituzione con metalli di base più economici in alcune applicazioni. I report di settore descrivono produttori leader di moduli come LONGi impegnati a ridurre il carico d’argento nelle loro celle solari, esplorando metallizzazione a base di rame e altre innovazioni per ridurre l’esposizione ai costi.
Questo crea una tensione: un’offerta strutturalmente limitata e una domanda in forte crescita per l’economia verde sostengono lo scenario rialzista, ma prezzi molto elevati gettano anche le basi per una futura distruzione della domanda e sostituzione - esattamente la dinamica di cui mette in guardia Kolanovic.
Posizionamento, ETF, Cina e il nuovo momentum trade
Questa corsa dell’argento appare diversa dai cicli precedenti perché il centro di gravità speculativo si trova altrove. Citi osserva che diversi segnali storicamente ribassisti - come il calo delle detenzioni globali di ETF sull’argento e il declino del posizionamento COMEX - non sono riusciti a rallentare i prezzi, indicando che gran parte degli acquisti proviene dai mercati dei futures e OTC asiatici piuttosto che dagli ETF occidentali.
Le cronache del movimento segnalano che i trader retail cinesi sono stati attori chiave, spingendo le autorità a inasprire le condizioni, incluso l’aumento dei margini sui futures e la limitazione delle nuove sottoscrizioni a un importante ETF domestico sull’argento.
Veicoli occidentali come iShares Silver Trust, Aberdeen Standard Physical Silver e Sprott Physical Silver Trust restano gateway importanti per investitori macro e retail, ma non sembrano più essere i principali driver marginali di quest’ultima gamba rialzista.
L’avvertimento di Kolanovic inquadra esplicitamente gli ETF sull’argento come trade macro affollati a rischio di un rapido unwind del posizionamento, mentre sono emersi prodotti ribassisti focalizzati sugli ETF per permettere agli investitori di posizionarsi contro quella che alcuni definiscono una “mania parabolica”. Entrambi gli schieramenti, rialzisti e ribassisti, concordano implicitamente su un punto cruciale: il posizionamento è estremo e qualsiasi cambiamento nei flussi potrebbe tradursi in movimenti molto ampi in entrambe le direzioni in un breve periodo.
Cosa potrebbe significare un drawdown del 50% o un picco a $150
Gli osservatori di mercato hanno notato che, se Kolanovic avesse ragione e l’argento scambiasse a circa la metà del prezzo attuale entro la fine del 2026, un movimento da circa $110–$115 alla fascia $50–$60 infliggerebbe pesanti perdite agli acquirenti di fine ciclo, ai trader con leva e ai minatori con costi più elevati. Un simile drawdown sarebbe doloroso ma non senza precedenti storici se confrontato con i precedenti crolli dell’argento e di altre materie prime. Potrebbe anche alleviare parte della pressione sugli utilizzatori industriali e accelerare un riequilibrio in cui il risparmio e la sostituzione rallentano, la domanda si stabilizza e il metallo potenzialmente costruisce una base per la prossima gamba secolare rialzista.
Se invece si realizzasse lo scenario rialzista tattico di Citi, un picco a $150 comprimerebbe ulteriormente il rapporto oro–argento e consoliderebbe lo status dell’argento come espressione ad alta beta della paura macro e della liquidità.
Tuttavia, tali livelli probabilmente intensificherebbero le risposte politiche nei mercati chiave - tramite regole di margine più severe, limiti all’accesso speculativo o altre misure - e darebbero ulteriore impulso agli sforzi nel solare e nell’elettronica per eliminare l’argento da quante più applicazioni possibile. Citi stessa avverte che, sebbene il bilancio domanda-offerta di medio-lungo termine appaia stretto, la volatilità di breve termine potrebbe aumentare dopo una simile impennata.
Punto chiave
L’argento si trova ora a un punto di svolta tra momentum e ritorno alla media. Da un lato, Citi vede potenti flussi macro, offerta fisica limitata e domanda speculativa spingere i prezzi fino a $150 nel breve termine. Dall’altro, Marko Kolanovic avverte che la storia raramente è clemente con i movimenti parabolici delle materie prime, con un drawdown del 50% come esito familiare una volta che il posizionamento si riduce e i prezzi elevati iniziano a distruggere la domanda.
Per trader e investitori, il messaggio è chiaro: l’argento può avere ancora spazio al rialzo, ma non è più una tranquilla copertura contro l’inflazione - è un trade macro ad alta volatilità e convinzione, dove timing e gestione del rischio contano più che mai.
Outlook tecnico sull’argento
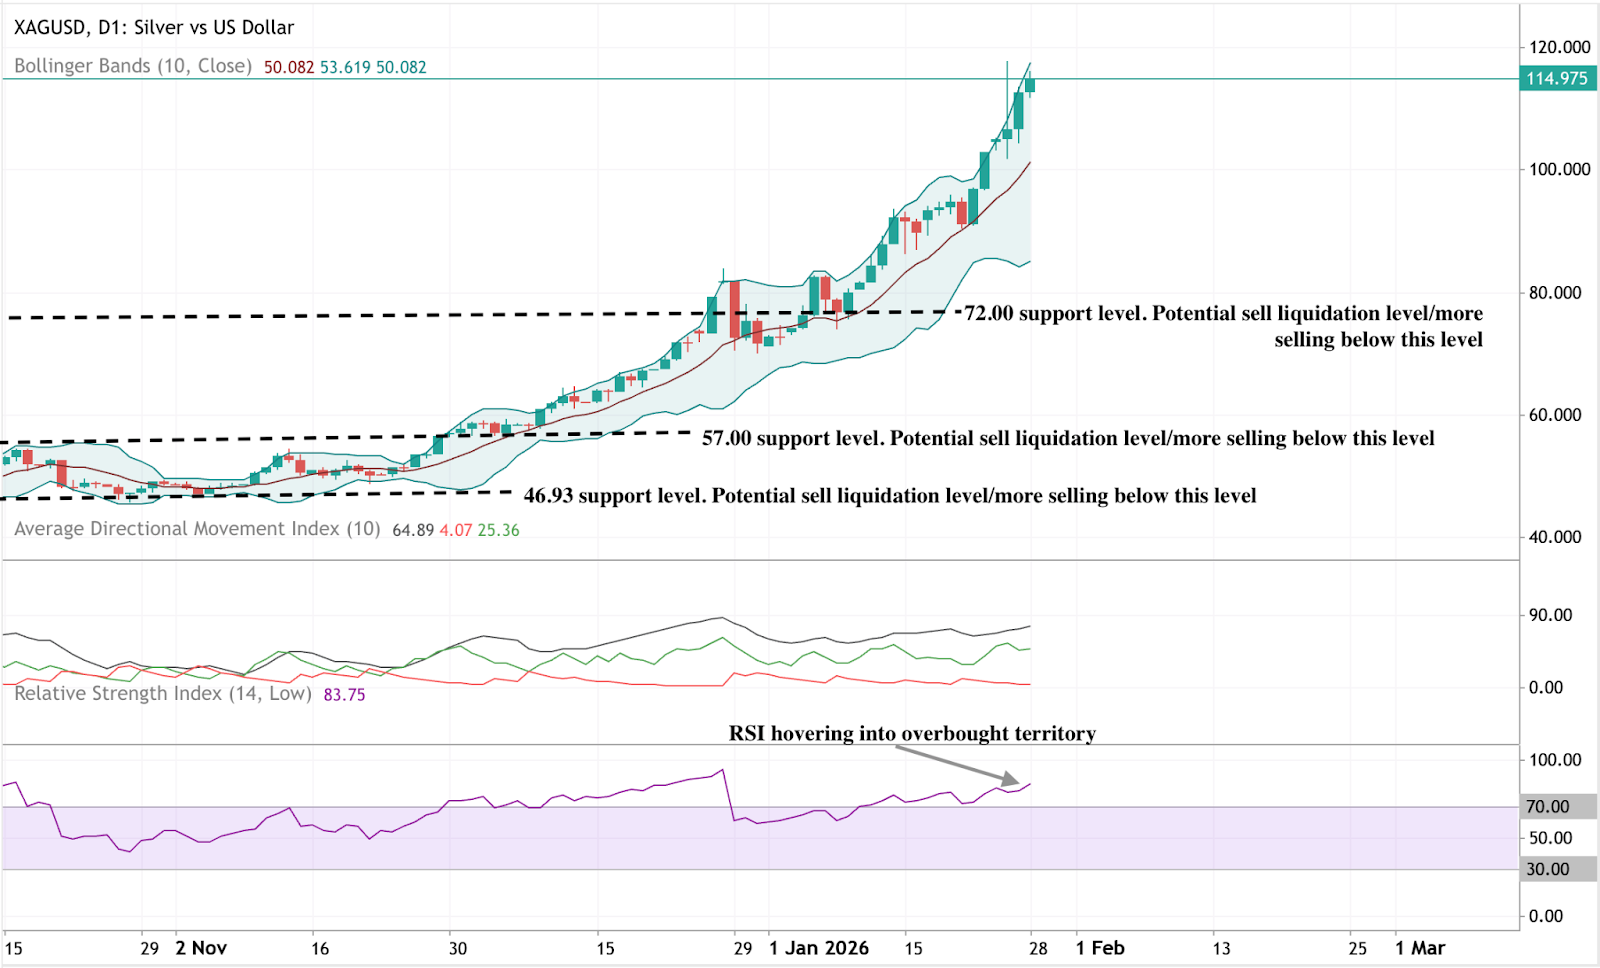
L’argento ha continuato a salire su nuovi livelli di prezzo, seguendo la banda superiore delle Bollinger Bands mentre la volatilità resta elevata. Le Bollinger Bands sono ampiamente espanse, indicando un ambiente di alta volatilità sostenuta dopo la recente accelerazione.
Gli indicatori di momentum mostrano letture estreme, con l’RSI in territorio di ipercomprato e l’ADX su livelli elevati, riflettendo una fase di trend forte e matura. Da una prospettiva strutturale, i prezzi attuali sono ben al di sopra delle precedenti aree di consolidamento intorno a $72, $57 e $46,93, illustrando la portata del movimento recente.
I dati sulle performance citati non costituiscono una garanzia di risultati futuri.


