월가의 전설이 가격이 ‘거의 확실하게’ 50% 하락할 것이라고 말하는 이유와 Citi의 150달러 목표

은은 단순히 반등한 것이 아니라 폭발적으로 상승해 1년 만에 거의 3배가 되었고, 온스당 100달러를 돌파했습니다. 하지만 월가에서 가장 유명한 전략가 중 한 명은 은 가격이 여기서 약 50% 하락할 것이 ‘거의 확실하다’고 경고하고 있습니다. 전 JPMorgan 수석 전략가 마르코 콜라노비치는 은의 포물선형 움직임이 전형적인 투기적 급등이라고 말합니다.
은 랠리는 얼마나 극단적인가?
지난 1년간 은 가격은 30달러 초반대에서 온스당 115~118달러의 사상 최고치까지 치솟으며 약 250~270%의 수익률을 기록했고, 금과 주요 주가지수를 모두 앞질렀습니다.
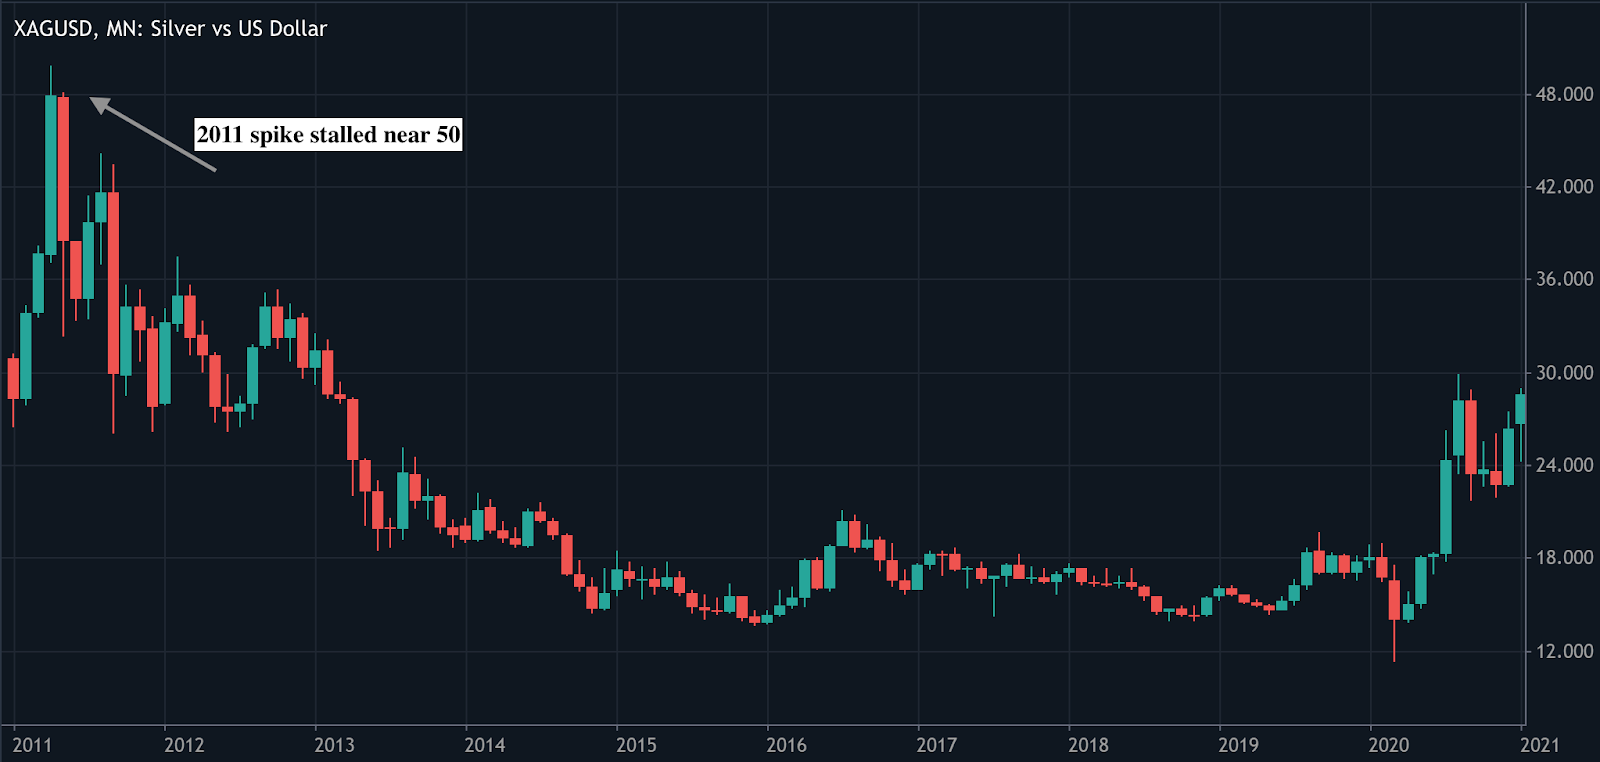
Citi는 이번 급등으로 은 가격이 이미 사상 최고치인 117.7달러에 도달했으며, 금-은 비율이 50 이하로 압축되면서 거래가 얼마나 극적으로 은 쪽으로 쏠렸는지 강조합니다. 참고로, 2011년 마지막 주요 급등은 50달러 부근에서 멈췄고 이후 수년간의 약세장이 이어졌으며, 오늘날의 가격 수준은 명목상 전례 없는 것입니다.
애널리스트들은 이번 움직임으로 은이 조용한 귀금속에서 하루에도 두 자릿수 변동폭을 보이는 헤드라인급 모멘텀 자산으로 변모했다고 지적합니다. 이러한 변동성은 상품 시장의 후반부에서 흔히 나타나며, 느리게 움직이는 펀더멘털이 아니라 주변 자금 흐름과 심리가 가격을 좌우합니다.
약세 시나리오: 콜라노비치의 “거의 확실한” 50% 폭락
콜라노비치의 경고는 단호합니다. 그는 은 가격이 “이 수준에서 1년 내에 약 50% 하락할 것이 거의 확실하다”고 말하며, 현재의 급등이 투기적 거품의 모든 특징을 갖추고 있다고 주장합니다.
그는 지속적인 펀더멘털 개선이 아니라 강한 모멘텀 매수, 밈 스타일의 거래 행태, 거시적 공포 포지셔닝이 주요 동인이라고 지적합니다. 그의 시각에서 은은 전통적인 가치 저장 수단이 아니라 양방향으로 과도하게 움직일 수 있는 레버리지 거시 상품처럼 거래되고 있습니다.
이 논리는 역사에 기반합니다. 포물선형으로 치솟은 상품은 부드럽게 횡보하지 않고, 포지션이 청산되고 주변 매수세가 사라지면 강하게 평균 회귀하는 경향이 있습니다. 2011년 은 가격 붕괴와 1970년대의 극심한 급등락이 대표적인 예로, 장기적 구조적 테마가 끝나지 않았더라도 극심한 하락이 뒤따랐습니다.
콜라노비치는 순수하게 허구적인 자산과 달리, 상품 거품은 결국 높은 가격이 산업 수요를 파괴하고, 재활용을 가속화하며, 신규 헤지 공급을 유인하면서 물리적 현실과 충돌하게 된다고 강조합니다.
강세 시나리오: Citi의 150달러 목표와 “스테로이드 맞은 금”
반면 Citi의 상품팀은 전술적으로 더 강세로 돌아서며, 0~3개월 은 가격 목표를 온스당 150달러로 상향 조정해 최근 수준에서 추가 30~40% 상승 여력을 시사합니다. Citi의 막시밀리안 레이튼은 “우리는 전술적으로 강세를 유지하며 0~3개월 목표가를 150달러로 상향한다”고 밝히며, 은의 현재 움직임을 “금의 제곱” 또는 “스테로이드 맞은 금”으로 표현했습니다. 이는 자본이 거시적 헤지로 몰리는 현상을 반영합니다.
은행 측은 이번 랠리가 전통적 펀더멘털보다는 자본 유입과 투기적 수요에 의해 주도되고 있지만, 이러한 흐름이 금에 비해 시장이 비싸 보이기 전까지는 더 이어질 수 있다고 봅니다.
Citi는 세 가지 주요 지지 요인을 강조합니다. 지정학적 위험 고조, 연준 독립성에 대한 우려 재점화, 그리고 중국 및 기타 아시아 투자자들이 주도하는 강한 투자 및 투기 수요입니다.
보고에 따르면 미국 외 지역의 실물 공급은 빠듯하며, 주요 시장에서 프리미엄이 높고 향후 몇 년간 지속적인 공급 부족이 예상됩니다. 이런 환경에서, 특히 중국 등에서 추세를 따르는 개인 투자자 자금이 계속 유입된다면, 은 가격은 본격적인 정상화 전까지 더 크게 오버슈팅할 수 있습니다.
산업 수요, 태양광, 그리고 대체 위험
투기적 거품 아래에서 은은 여전히 산업용 금속의 역할을 하고 있습니다. 현재 산업용 수요가 전 세계 은 수요의 약 58%를 차지하며, 신재생 에너지, 전자, 자동차 분야가 특히 중요합니다.
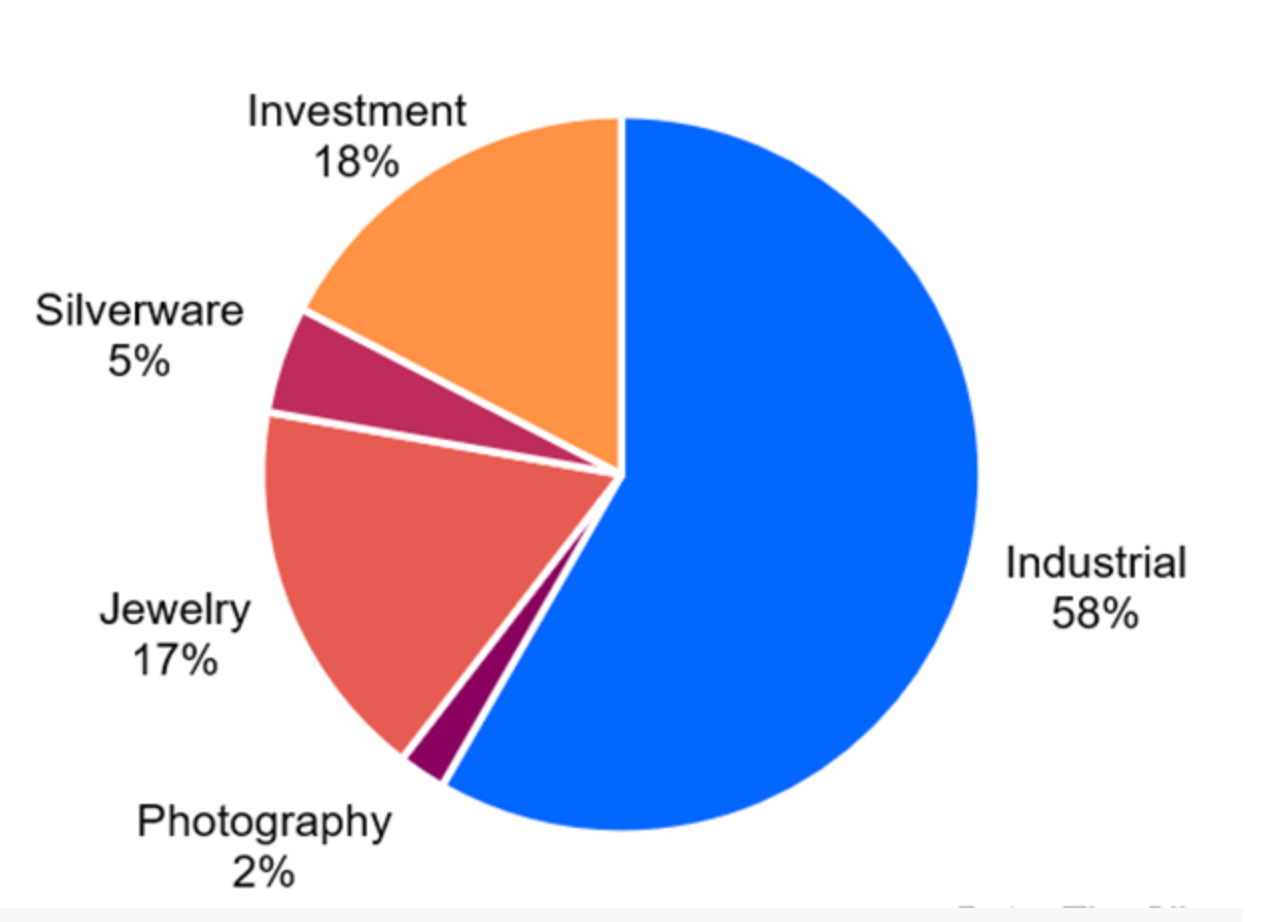
Silver Institute와 Metals Focus는 산업 수요가 약 7억 온스에 이를 것으로 예상하며, 이는 주로 은의 전도성이 태양광 전지에 필수적인 태양광 발전에 의해 주도됩니다. 최근 추정에 따르면 태양광만으로도 2024년 전체 은 수요의 약 19~20%, 즉 약 2억 3천만 온스를 차지할 수 있으며, 이는 2022년 대비 거의 두 배에 달합니다.
동시에 높은 가격은 이미 일부 용도에서 값싼 비철금속으로의 “은 절감”과 대체를 가속화하고 있습니다. 업계 보고서에 따르면 LONGi와 같은 주요 모듈 제조업체들은 태양광 전지의 은 사용량을 줄이고, 구리 기반 금속화 등 비용 노출을 줄이기 위한 혁신을 모색하고 있습니다.
이로 인해 구조적으로 빠듯한 공급과 급증하는 친환경 경제 수요가 강세 논리를 뒷받침하는 한편, 너무 높은 가격은 미래 수요 파괴와 대체의 씨앗을 뿌리게 됩니다. 이는 콜라노비치가 경고한 바로 그 역동성입니다.
포지셔닝, ETF, 중국, 그리고 새로운 모멘텀 트레이드
이번 은 랠리는 과거와 달리 투기적 중심축이 다른 곳에 있습니다. Citi는 글로벌 은 ETF 보유량 감소, COMEX 포지션 감소 등 전통적으로 약세 신호로 여겨지는 지표들이 가격 하락을 막지 못하고 있다고 지적합니다. 이는 상당수 매수가 서구 ETF가 아니라 아시아 선물 및 OTC 시장에서 유입되고 있음을 시사합니다.
이번 움직임에 대한 보도에 따르면 중국 개인 투자자들이 핵심 역할을 하면서 당국이 선물 증거금 인상, 주요 국내 은 ETF 신규 가입 제한 등 조건을 강화했습니다.
iShares Silver Trust, Aberdeen Standard Physical Silver, Sprott Physical Silver Trust 등 서구 상품은 여전히 거시 및 개인 투자자에게 중요한 관문이지만, 이번 상승 국면의 주요 동인은 더 이상 아닌 것으로 보입니다.
콜라노비치는 은 ETF를 포지션이 과도하게 몰린 거시 트레이드로 명확히 규정하며, 포지션 청산 위험이 크다고 경고합니다. 한편, 약세 ETF 상품도 등장해 일부 투자자들이 “포물선형 광기”에 베팅할 수 있게 했습니다. 강세와 약세 양 진영 모두 한 가지 중요한 점에 암묵적으로 동의합니다. 바로 포지셔닝이 극단적이며, 자금 흐름이 바뀌면 단기간에 양방향으로 큰 변동이 나타날 수 있다는 점입니다.
50% 하락 또는 150달러 급등이 의미하는 것
시장 관찰자들은 콜라노비치의 전망대로 2026년 말까지 은 가격이 최근의 절반 수준(약 110~115달러에서 50~60달러)으로 떨어진다면, 후반부 매수자, 레버리지 트레이더, 고비용 광산업체에 큰 손실이 발생할 것이라고 지적합니다. 이러한 하락은 고통스럽지만, 과거 은 및 기타 상품의 붕괴와 비교하면 역사적으로 전례 없는 일은 아닙니다. 또한 산업 수요자에 대한 압박을 완화하고, 절감 및 대체가 둔화되며, 수요가 안정화되고, 은이 다음 장기 상승을 위한 기반을 다질 수 있는 재조정이 가속화될 수 있습니다.
반대로 Citi의 전술적 강세 시나리오가 실현되어 150달러까지 급등한다면, 금-은 비율이 더 압축되고, 은은 거시적 공포와 유동성의 고베타 표현으로 자리매김할 것입니다.
하지만 이런 수준에서는 주요 시장에서 마진 규정 강화, 투기 접근 제한 등 정책 대응이 강화되고, 태양광 및 전자 업계에서 은을 대체하려는 노력이 더욱 가속화될 가능성이 높습니다. Citi 역시 중장기적으로는 수급 균형이 빠듯해 보이지만, 단기적으로는 급등 이후 변동성이 커질 수 있다고 경고합니다.
핵심 요약
은은 현재 모멘텀과 평균 회귀의 변곡점에 서 있습니다. 한쪽에서는 Citi가 강력한 거시 자금 흐름, 빠듯한 실물 공급, 투기적 수요가 단기적으로 150달러까지 가격을 밀어올릴 수 있다고 봅니다. 반면 마르코 콜라노비치는 역사적으로 포물선형 상품 급등이 순탄하게 끝난 적이 드물며, 포지션 청산과 고가격에 의한 수요 파괴가 시작되면 50% 하락이 흔한 결과라고 경고합니다.
트레이더와 투자자에게 메시지는 분명합니다. 은은 여전히 추가 상승 여력이 있을 수 있지만, 더 이상 조용한 인플레이션 헤지가 아니라, 타이밍과 리스크 관리가 그 어느 때보다 중요한 고변동성, 고확신 거시 트레이드입니다.
은 기술적 전망
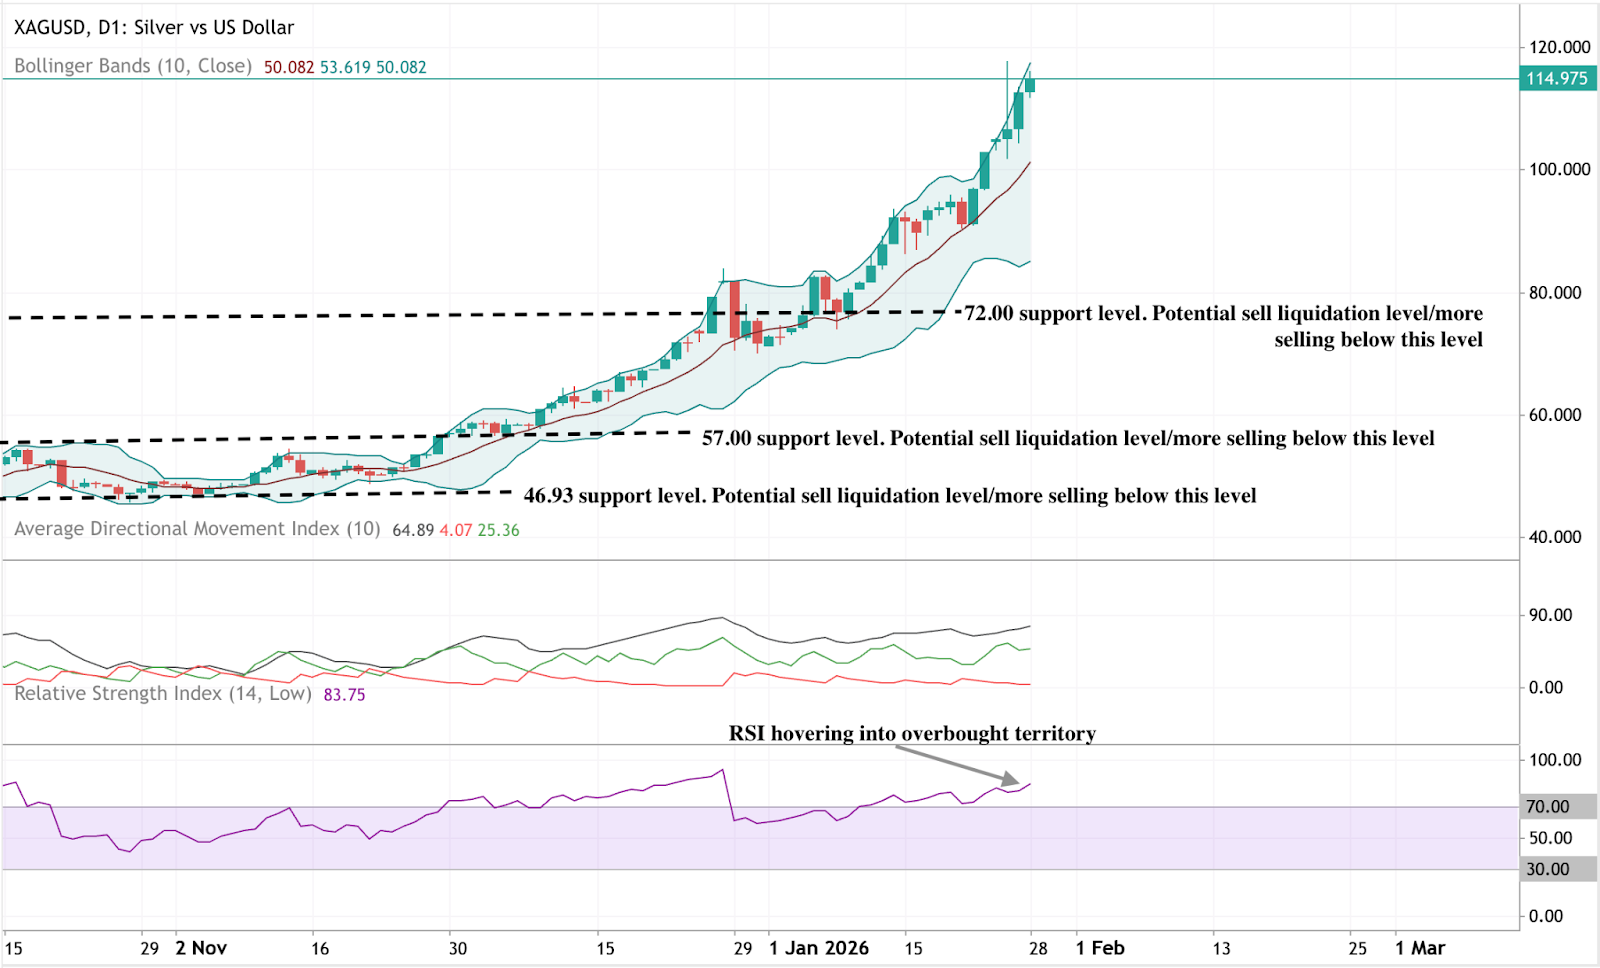
은은 최근 가속화 이후 변동성이 높게 유지되며 상단 Bollinger Band를 따라 새로운 가격 영역으로 계속 상승하고 있습니다. Bollinger Bands는 크게 확장되어 최근 가속 이후 지속적인 고변동성 환경을 나타냅니다.
모멘텀 지표는 극단적인 수치를 보이고 있으며, RSI는 과매수 구간에, ADX는 높은 수준에 있어 강하고 성숙한 추세 국면을 반영합니다. 구조적으로 현재 가격은 72달러, 57달러, 46.93달러 부근의 이전 박스권을 훨씬 상회하고 있어 최근 움직임의 규모를 보여줍니다.
인용된 수익률 수치는 미래의 성과를 보장하지 않습니다.


