Is the U.S. manufacturing slowdown pushing oil prices toward $60-70?
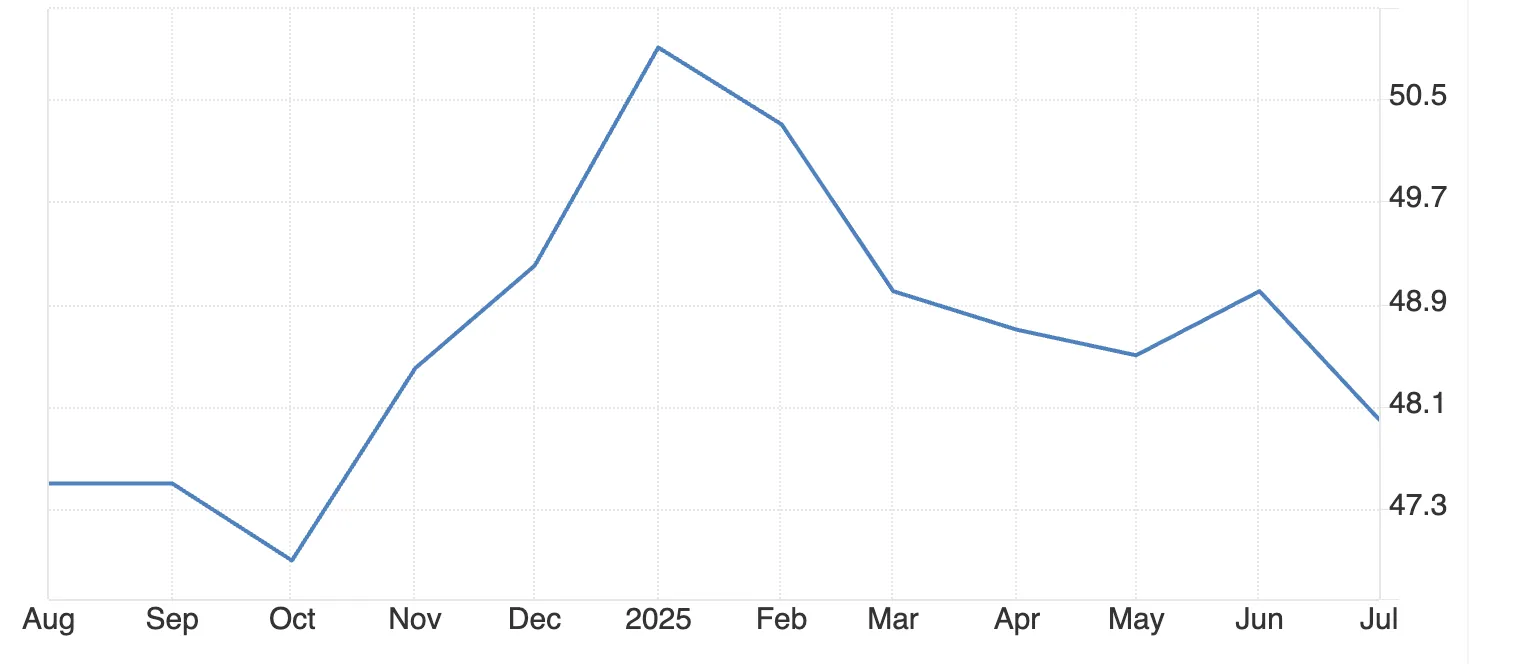
The U.S. manufacturing sector contracted for the fifth consecutive month in July 2025, with the Institute for Supply Management (ISM) PMI falling to 48, creating significant downward pressure on oil demand. This trend, combined with weakening industrial activity, could drive crude prices toward the $60-70 range seen in previous economic slowdowns, according to analysts.
Key takeaways
- The U.S. manufacturing sector contracted to 48 PMI in July 2025, continuing a five-month decline that threatens global oil demand.
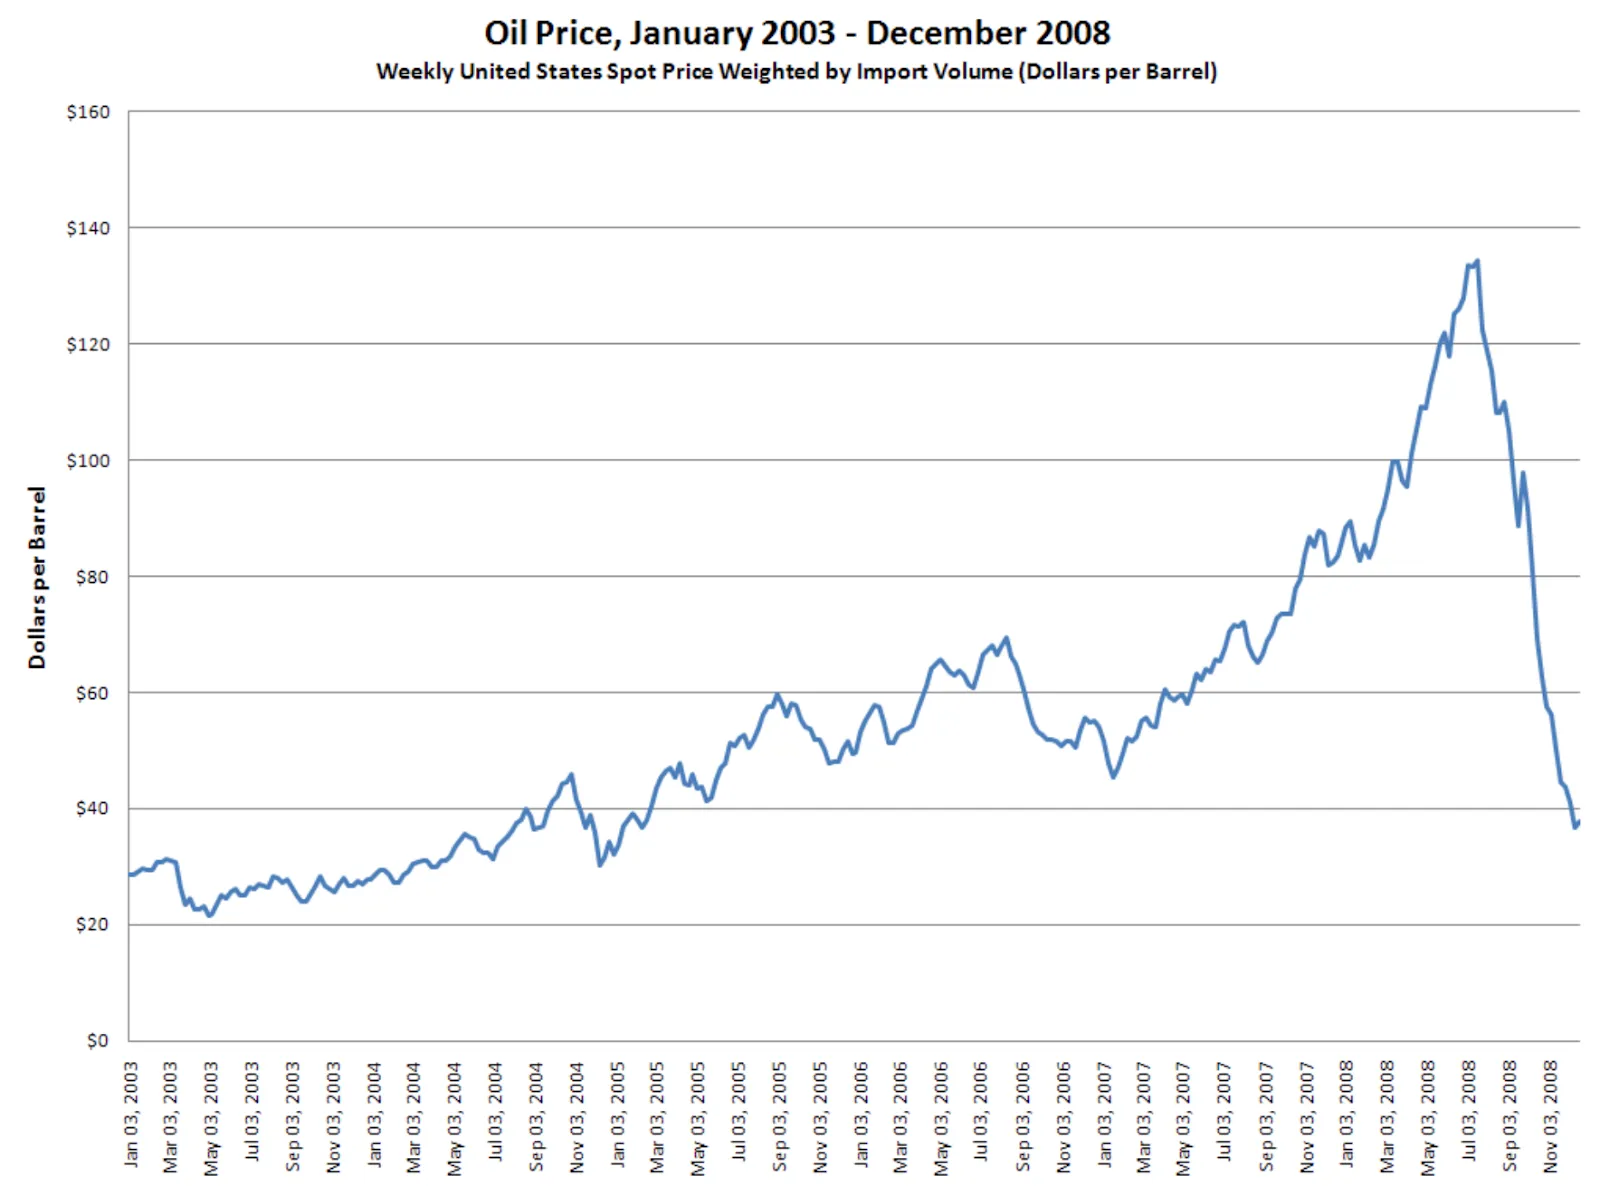
- Manufacturing employment dropped 25% (the sharpest cut since COVID-19) while new orders fell for 6 consecutive months. Historical precedent from 2008 shows similar manufacturing weakness preceded oil price crashes from $147 to under $40 per barrel.
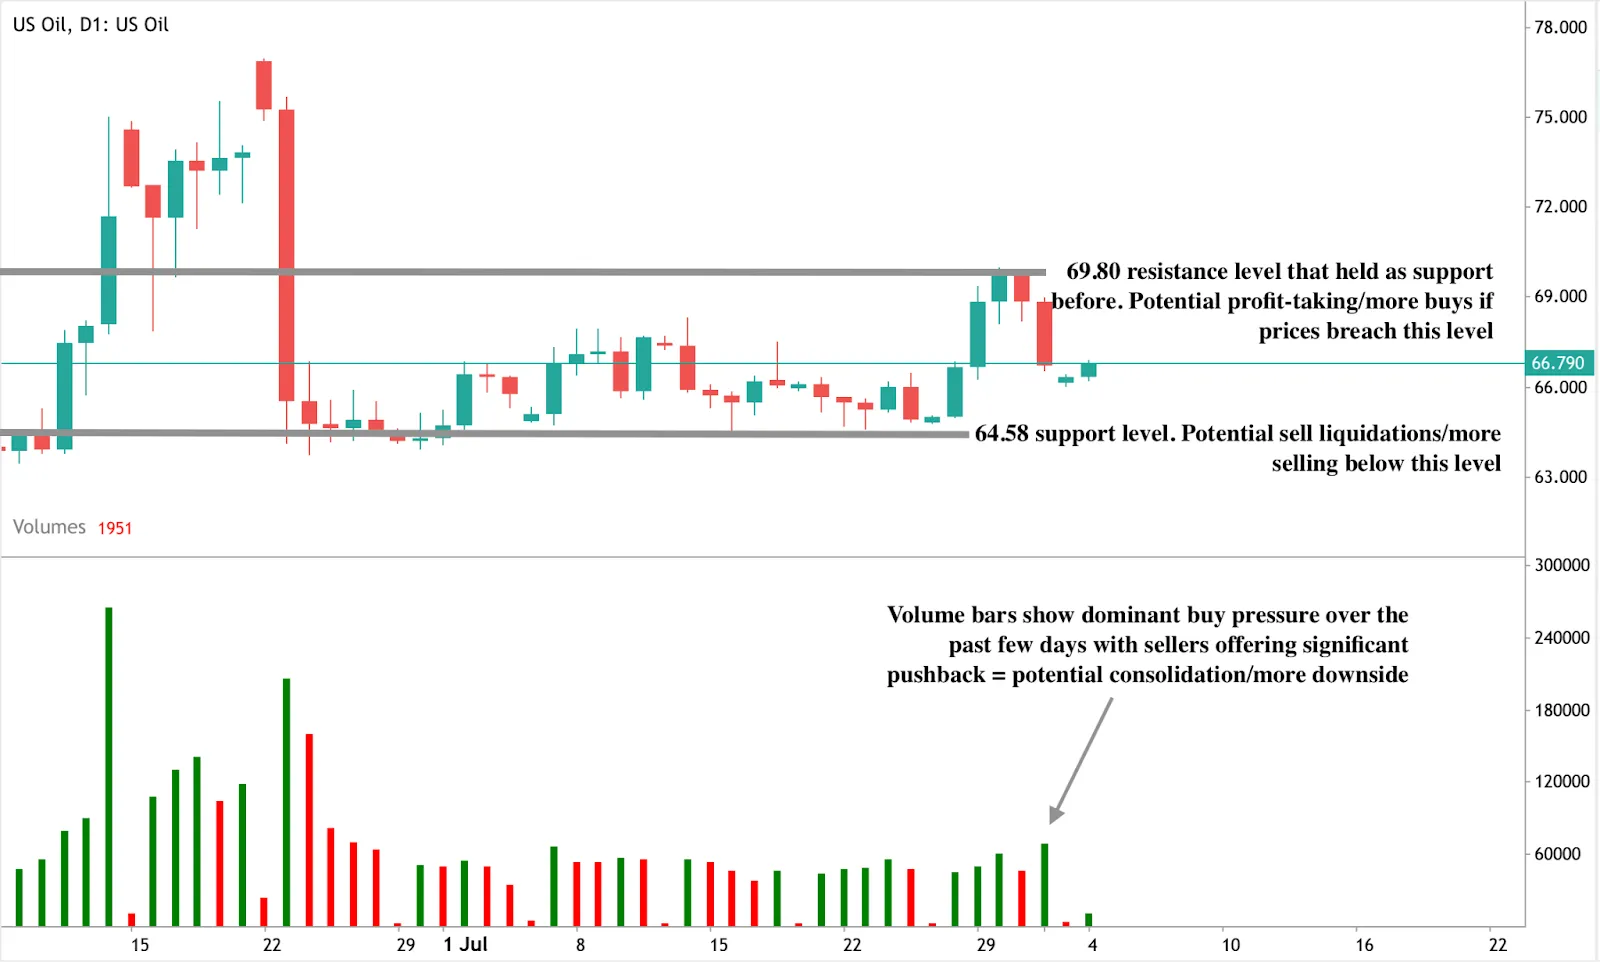
- Current crude prices around $66-67 face downward pressure, with key support at $64.58 and resistance at $69.80.
Manufacturing and oil demand connection
Manufacturing drives oil consumption through three primary channels. Heavy machinery requires diesel fuel for operations, while transportation networks need petroleum products to move goods. Supply chain logistics consume significant gasoline and diesel volumes when factories operate at full capacity.
The July 2025 Manufacturing PMI of 48 indicates contraction below the neutral 50 threshold. This directly correlates with reduced petroleum demand across industrial sectors. The Institute for Supply Management data shows manufacturing activity declining for 31 out of the last 33 months, creating sustained downward pressure on oil consumption.
Employment data reveals deeper structural concerns. The manufacturing employment index reached 43.4 in July 2025, marking a post-pandemic low. Fewer manufacturing workers means reduced commuting fuel demand, lower industrial production, and decreased supply chain activity.
Historical precedent for manufacturing-driven oil price declines
The 2008 financial crisis demonstrates how manufacturing contractions impact oil markets. Crude prices collapsed from $147 per barrel in July to under $40 by December 2008 as industrial demand evaporated.
Current conditions show similar patterns as noted by experts: sustained PMI readings below 50, rising input costs, and constrained business investment.
Manufacturing weakness typically precedes broader economic slowdowns that significantly reduce oil demand. The current five-month contraction period matches early warning signs from previous recessionary periods that led to substantial crude price declines.
Policy headwinds amplifying demand weakness
Tariff policies increase manufacturing input costs, while the Federal Reserve interest rate policy constrains business expansion. Higher production costs reduce industrial activity and logistics volumes, two major petroleum consumption drivers. These policy factors compound underlying manufacturing weakness.
The U.S. Energy Information Administration projects crude oil production declining from 13.5 million barrels per day in April 2025 to 13.3 million barrels per day by end-2026. WTI crude prices are forecast to fall to $53 per barrel through 2026, representing a 22% decline from June 2025 levels.
Global demand cannot offset U.S. manufacturing decline
India’s oil consumption reportedly increased 3.1% to 5.6 million barrels per day in 2025, while China’s declined 1.2% to 16.4 million barrels per day. However, emerging market energy consumption often involves subsidised pricing that provides limited support for global oil prices.
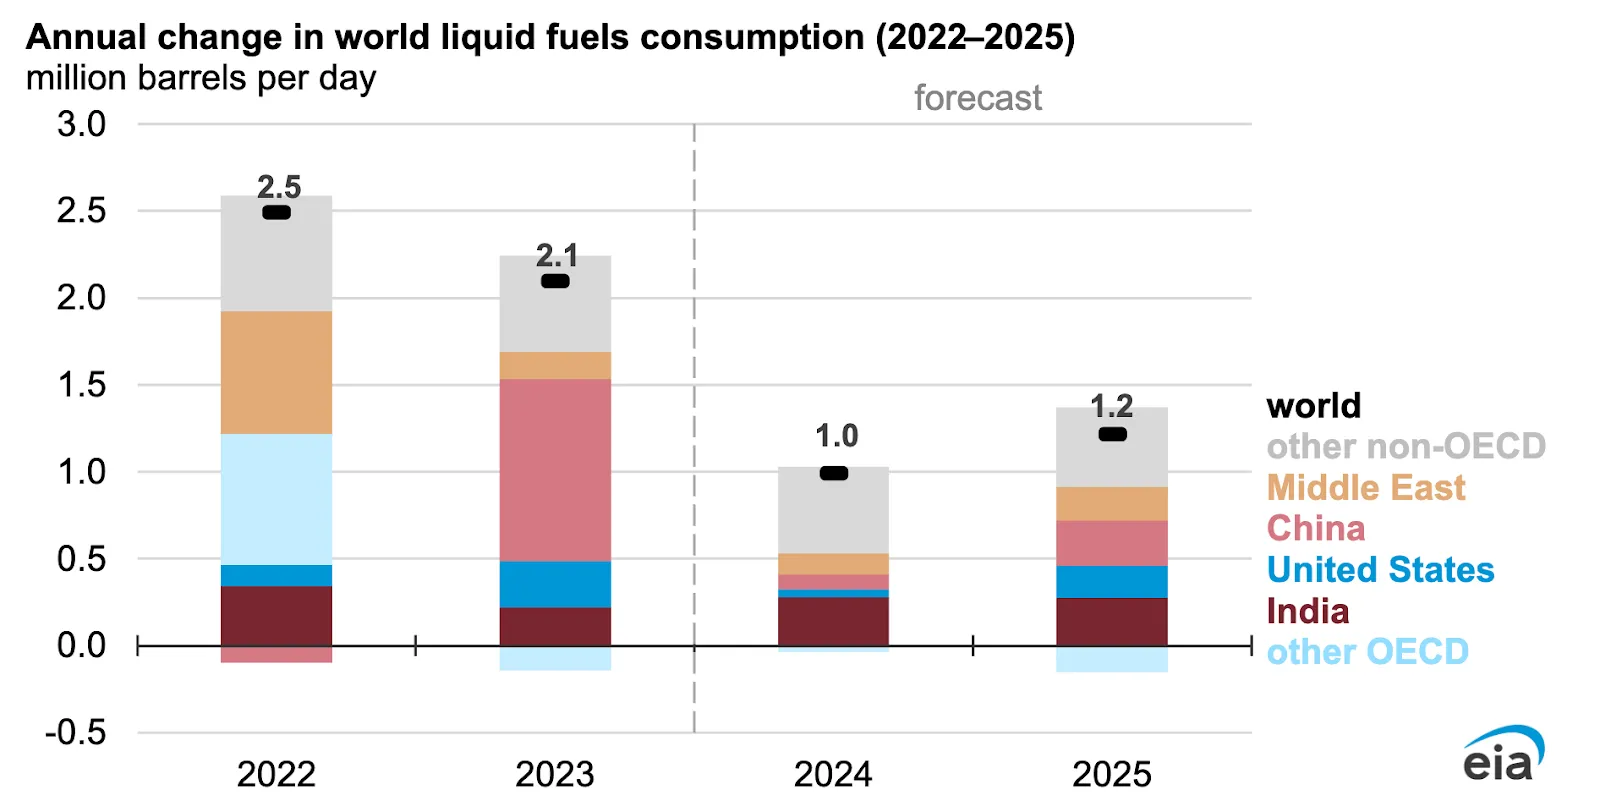
Global manufacturing shifts to lower-cost countries represent demand reshuffling rather than net demand growth. Given America's position as the world's largest oil consumer, emerging market consumption increases cannot fully offset potential U.S. industrial demand declines.
Supply-side factors and geopolitical risks
OPEC+ gradually unwinds voluntary production cuts while global output remains stable at 101.8 million barrels per day. Geopolitical tensions, including Israel-Iran conflicts and potential secondary sanctions on Russian oil buyers, create upside price risks, according to analysts.
Supply disruptions could temporarily support prices, but sustained manufacturing weakness suggests demand-side factors will dominate market direction. Unless significant geopolitical events occur, oversupply conditions may develop as industrial demand continues declining.
Oil price outlook and trading levels
Current technical analysis shows oil prices recovering from weekend lows with buying pressure emerging. Key resistance stands at $69.80 while critical support remains at $64.58. Break below support levels could accelerate moves toward the $60-70 target range.
The EIA's forecast of $53 per barrel WTI by end-2026 aligns with manufacturing-driven demand weakness. Declining U.S. production combined with reduced industrial consumption creates a bearish price environment absent major supply shocks.
What does this mean for oil prices in 2025?
Manufacturing PMI readings below 50 for five consecutive months signal sustained industrial weakness. New orders declining for six months indicate continued manufacturing contraction ahead. Employment cuts of 25% suggest reduced energy consumption across multiple sectors.
Oil prices are likely to drift toward the $60-70 per barrel range unless manufacturing conditions improve or significant supply disruptions occur. The quiet decline of U.S. industrial activity may prove more impactful than dramatic geopolitical events on crude price direction.
Frequently asked questions
- How does U.S. manufacturing affect global oil prices?
The U.S. consumes approximately 20% of global oil production. Manufacturing drives demand for diesel, gasoline, and petroleum products through industrial operations, transportation, and supply chain logistics.
- What manufacturing PMI level signals oil market concern?
PMI readings below 50 indicate manufacturing contraction. The current 48 level sustained for five months suggests significant petroleum demand weakness ahead.
- Can emerging markets offset U.S. manufacturing decline?
Emerging market oil demand growth involves subsidised energy pricing and cannot fully replace potential U.S. industrial demand losses given America’s consumption scale.
- What are key oil price levels to watch?
The trading range is defined by current resistance at $69.80 and support at $64.58. Breaks below $64.58 could accelerate moves toward $60-70 targets.
Investment implications
Manufacturing weakness suggests sustained downward pressure on oil prices through 2025 according to analysts. The $60-70 per barrel range represents realistic expectations absent supply shocks. Geopolitical risks remain the primary upside catalyst, while manufacturing data indicates continued demand headwinds.
Investors should monitor manufacturing PMI, employment data, and new orders as leading indicators of petroleum demand trends. Policy changes affecting trade or monetary conditions could alter the trajectory.
Disclaimer:
The performance figures quoted are not a guarantee of future performance.


