Gold’s November surge: From $4,000 barrier to all-time highs. What’s really happening?

Imagine waking up to headlines screaming 'Gold Smashes Past $4,300,' and no, it’s not a dream; it has been the reality of October 2025. Now, November’s keeping the momentum alive with prices hovering near $4,132 as of 25 November 2025. If you’re wondering whether this shiny metal remains a smart addition to your financial mix, stick around. We’re breaking down the fresh data, historical peaks, and practical takeaways without the hype.
Why is gold climbing so sharply in late 2025?
The gold spot price breached $4,100 per ounce on November 24, a 1.65% increase from the prior day, driven by investor bets on U.S. Federal Reserve rate cuts amid cooling inflation signals. This isn't random volatility; it's a response to broader economic jitters. Geopolitical tensions, like ongoing Russia-Ukraine talks, add a layer of safe-haven demand, pushing prices up even as crude oil dips on "peace" rumours.
Breaking it down: Central banks worldwide are projected to acquire over 900 tons of gold in 2025, according to reports, surpassing demand for jewellery and technology. This institutional buying creates a floor under prices - think of it as a global vote of confidence in gold as a hedge against currency wobbles.
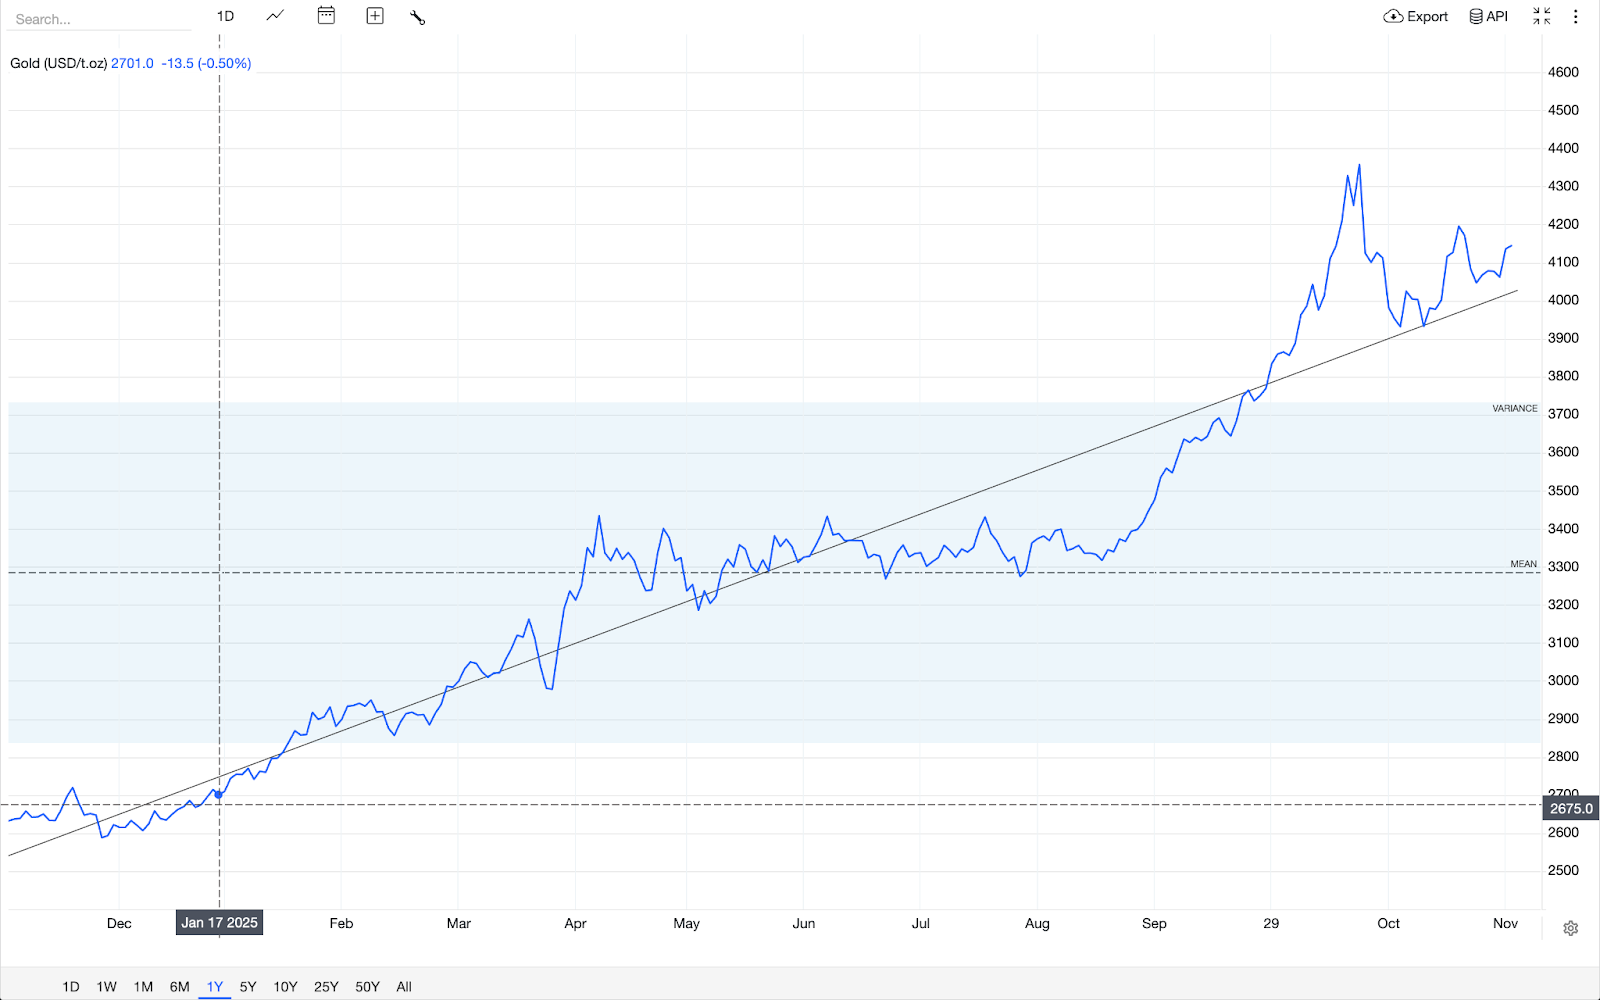
For everyday folks, it means reviewing your asset allocation might reveal whether gold’s 58% year-to-date gain (from -$2,600 in January) aligns better with your risk tolerance now than it did during last year’s flatline.
How close is gold to its historic peaks, and what do the charts say?
Gold’s all-time high? $4,379.13 on October 17, 2025, eclipsing the inflation-adjusted 1980 record of about $3,400 (when an ounce topped $850 nominally). Fast-forward to November: Spot prices traded between $4,046 and $4,145 on 24 November, coiling in a bull pennant pattern on daily charts - a setup that hints at continuation if it breaks upward, based on Kitco’s intra-day analysis.
Visualise this: On a 5-minute Comex futures chart, gold is hugging the 50-period moving average as support around $4,010, with resistance at $4,108. Zoom out to weekly: It’s testing the upper Bollinger Band after a 3.7% monthly rise.

Historically, such consolidations after highs (like the post-2020s $2,070 peak) often precede 10-15% corrections or fresh legs up - a reminder to track these levels when assessing gold’s role in long-term savings, such as in a retirement portfolio.
Expert take: "Gold’s resilience stems from its inverse correlation to real yields,” notes FX Empire analyst Yoav Niv, who points to the metal’s consolidation amid delayed U.S. data releases. Actionable angle? If inflation reports this week nudge yields lower, gold could revisit its October high - use that as a cue to compare gold’s performance against your bond or cash holdings.
Gold’s role in everyday portfolios
Hypothetically, let’s consider a mid-40s couple in Chicago, facing 7% inflation that ate into their savings in 2024. So, they shifted 5% of their nest egg to a gold ETF in early 2025; by November, that slice would have grown 58%, offsetting spikes in grocery and housing costs. Nothing magical here, but gold acting as a diversifier when stocks wobble.
Or take an example of a small business like a jeweller who rode out November’s uptick by locking in supplier rates at $4,000, buffering against dollar strength that hammered imports. The insight? Gold isn’t just for vaults; it’s a tool for smoothing cash flow volatility.
Scan your expenses - if currency fluctuations hit suppliers or travel, a modest gold exposure (via accessible ETFs) could stabilise planning without overcomplicating things.
November’s gold action underscores its enduring appeal: a buffer against the unpredictable. Whether eyeing historic charts or current consolidations, the key is integration - weave it into your financial story thoughtfully.
Gold technical insights
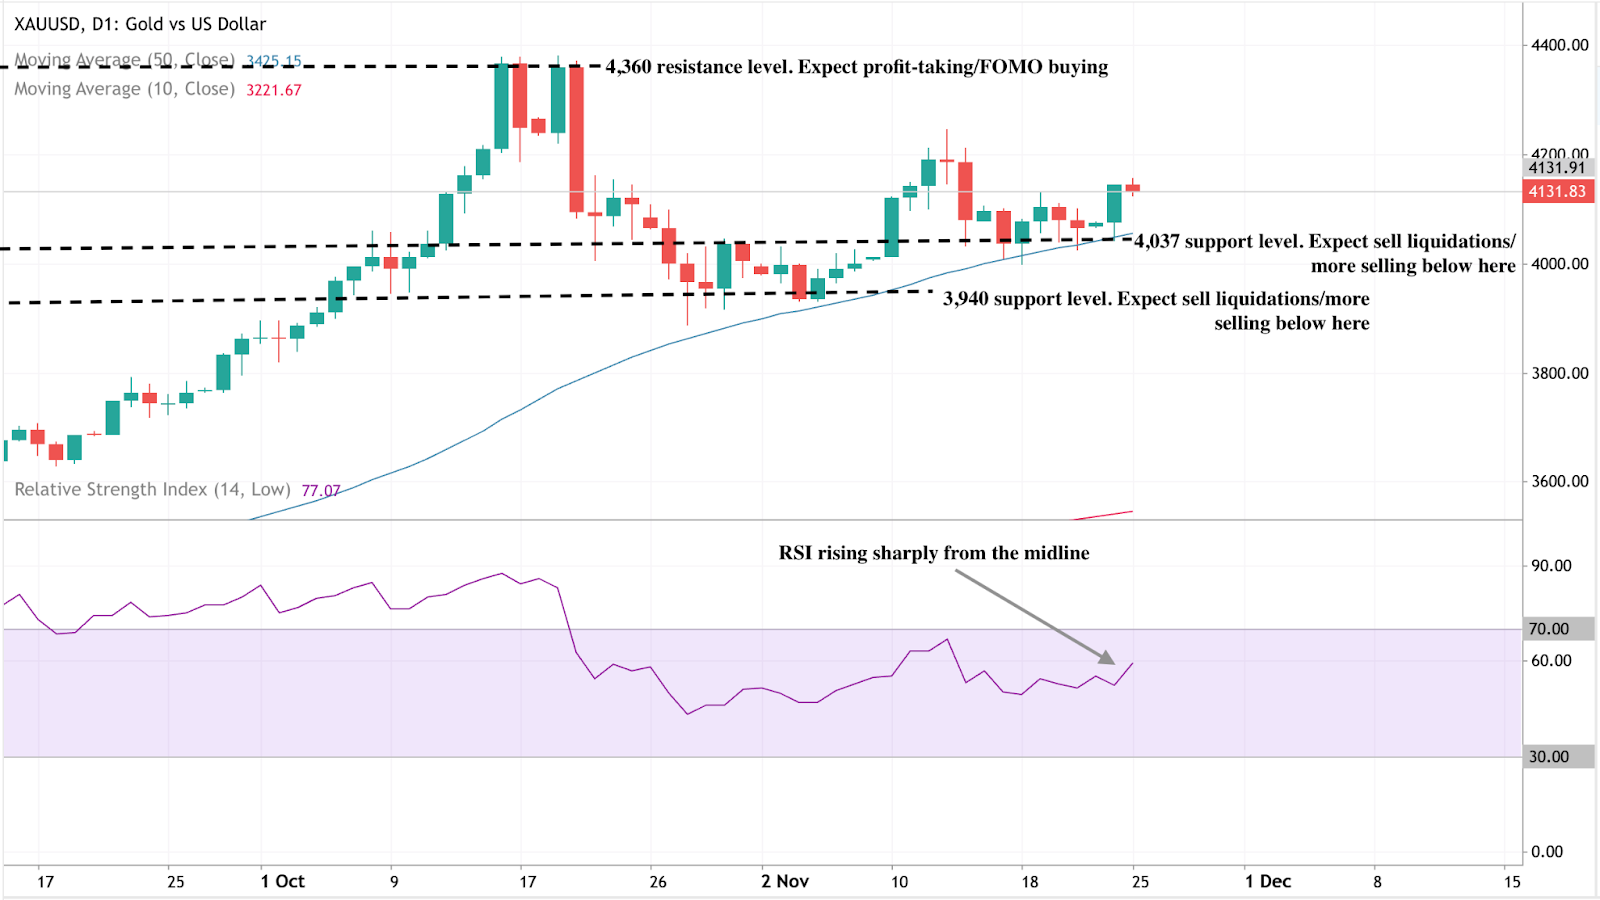
At the start of writing, Gold (XAU/USD) is trading near $4,132, maintaining bullish momentum above key supports at $4,037 and $3,940. A sustained move above these levels suggests buyers remain in control, though a drop below either could trigger sell liquidations.
The $4,360 level stands out as a major resistance, where traders may take profits or new buyers could enter on FOMO sentiment. Meanwhile, the RSI has surged to around 77, rising sharply from the midline - a signal of strengthening momentum but also a potential sign of overbought conditions that could invite short-term pullbacks.
The performance figures quoted are not a guarantee of future performance.


