How far could the precious metals rally really go?
.jpg)
At this point, the more relevant question may be how much stress global markets are already pricing in. Gold breaking above $5,000 an ounce and silver outperforming almost every major asset suggest investors are no longer hedging short-term risks, but repositioning for a longer period of economic and political instability.
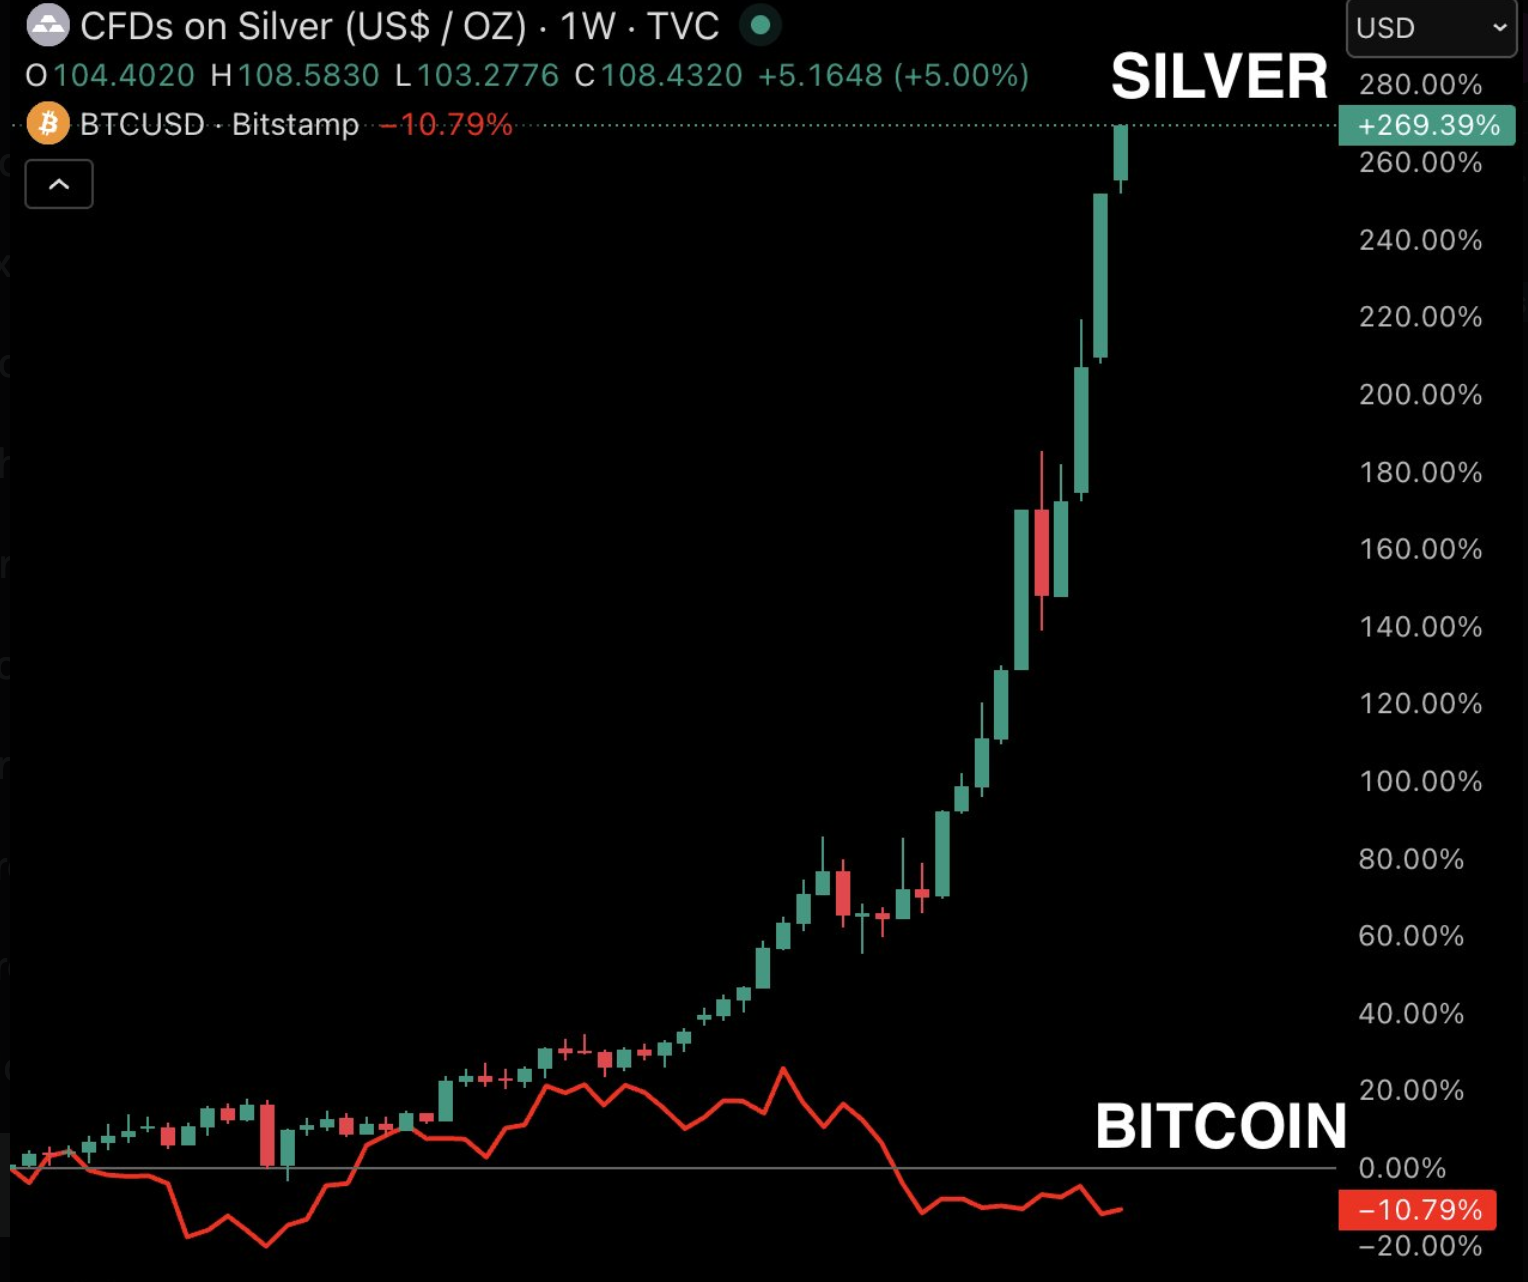
Gold is up more than 65% over the past year, while silver has surged roughly 270% in just over thirteen months. Those moves have unfolded alongside rising global debt, renewed geopolitical tensions, and early signs of US dollar weakness. Together, they point to a rally driven less by speculation and more by a deepening loss of confidence in traditional financial anchors.
What’s driving the precious metals rally?
At the heart of the rally is a global shift towards what analysts increasingly call the “debasement trade”. Investors are buying hard assets to protect purchasing power as government debt levels rise and fiscal credibility weakens.
According to Robin Brooks of the Brookings Institution, the surge in precious metals prices reflects growing market fear that governments may attempt to inflate away debt that has become politically and economically unmanageable.
Currency dynamics have added fuel to the move. After remaining resilient through much of last year, the US dollar has started 2026 on a softer footing.
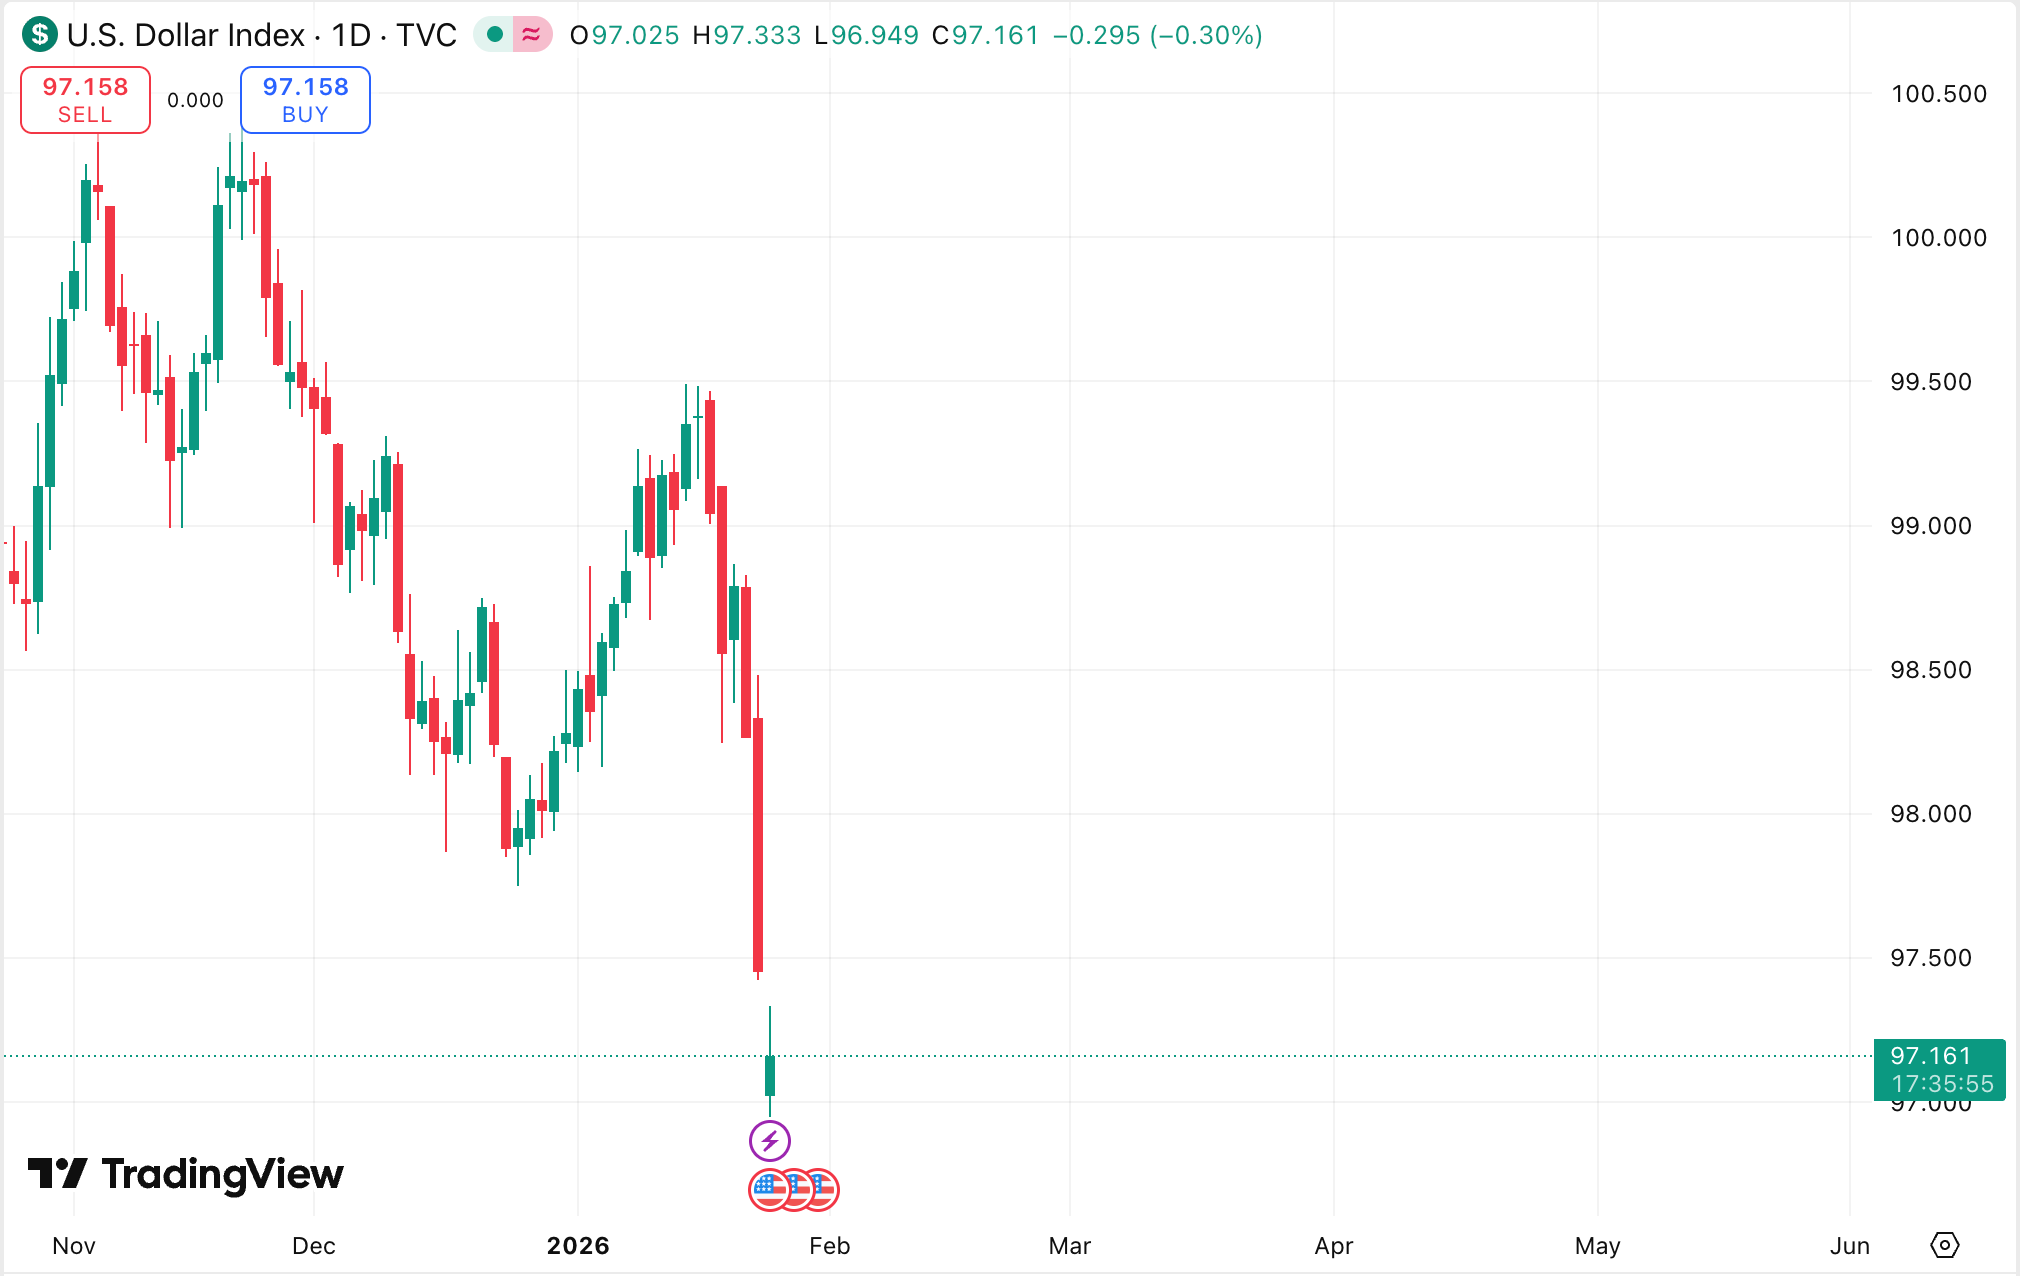
A weaker dollar boosts demand for gold and silver from non-US buyers and reinforces their appeal as alternative stores of value. This backdrop has been compounded by geopolitical flashpoints, from stalled Russia–Ukraine peace talks to tensions involving Venezuela and Greenland, each reinforcing demand for assets perceived as politically neutral.
Why it matters
The scale and breadth of participation set this rally apart from previous precious metals cycles. While central banks continue to buy gold aggressively, averaging around 60 tonnes per month, analysts argue they are no longer the dominant driver. Instead, private investors, institutions, and high-net-worth families are playing a growing role as concerns over fiscal sustainability and policy credibility linger.
Goldman Sachs notes that Western gold ETF holdings have increased by roughly 500 tonnes since early 2025, while physical purchases have become a preferred hedge against macro and policy risk. Brooks has warned that the broad rise across gold, silver, and other metals weakens the argument that central bank diversification alone explains the rally, pointing instead to a widespread shift in investor psychology.
Impact on markets and consumers
The rally is already reshaping behaviour far beyond financial markets. In China, record gold and silver prices have triggered a surge in demand for physical investment products, pushing factories to operate overtime. Manufacturers that once focused on jewellery production have pivoted towards producing silver bars as demand for investment-grade metals accelerates.
Silver’s performance has been particularly striking. Spot prices jumped 3% in a single session this week, lifting silver’s market capitalisation to roughly 3.5 times that of Bitcoin.
Unlike gold, silver also benefits from industrial demand, particularly in energy and electronics, creating a tighter supply-demand balance that has left many retail products in short supply across Asia.
Expert outlook
Forecasts suggest the rally may still have room to run, though volatility risks are rising. Goldman Sachs has lifted its year-end gold target to $5,400 an ounce, arguing that hedges against global macro-policy risks, including fiscal sustainability concerns, are likely to remain in place through 2026. Union Bancaire Privée similarly expects gold to reach $5,200 by year-end on sustained institutional and retail demand.
Still, the outlook is not one-directional. Elevated prices increase sensitivity to shifts in interest-rate expectations and geopolitical developments. Markets are closely watching President Trump’s choice for the next Federal Reserve Chair, as a more dovish appointment could further reduce the opportunity cost of holding non-yielding assets like gold. Conversely, any easing of geopolitical tensions could test the rally’s durability.
Key takeaway
How far the precious metals rally can go depends less on technical levels and more on whether confidence in currencies, fiscal policy, and geopolitical stability continues to erode. Gold and silver are no longer reacting to isolated shocks but to a broader re-pricing of risk. While volatility is likely to increase as prices rise, the underlying demand drivers remain firmly in place. The next decisive signals will come from monetary policy leadership, currency trends, and the trajectory of global conflict.
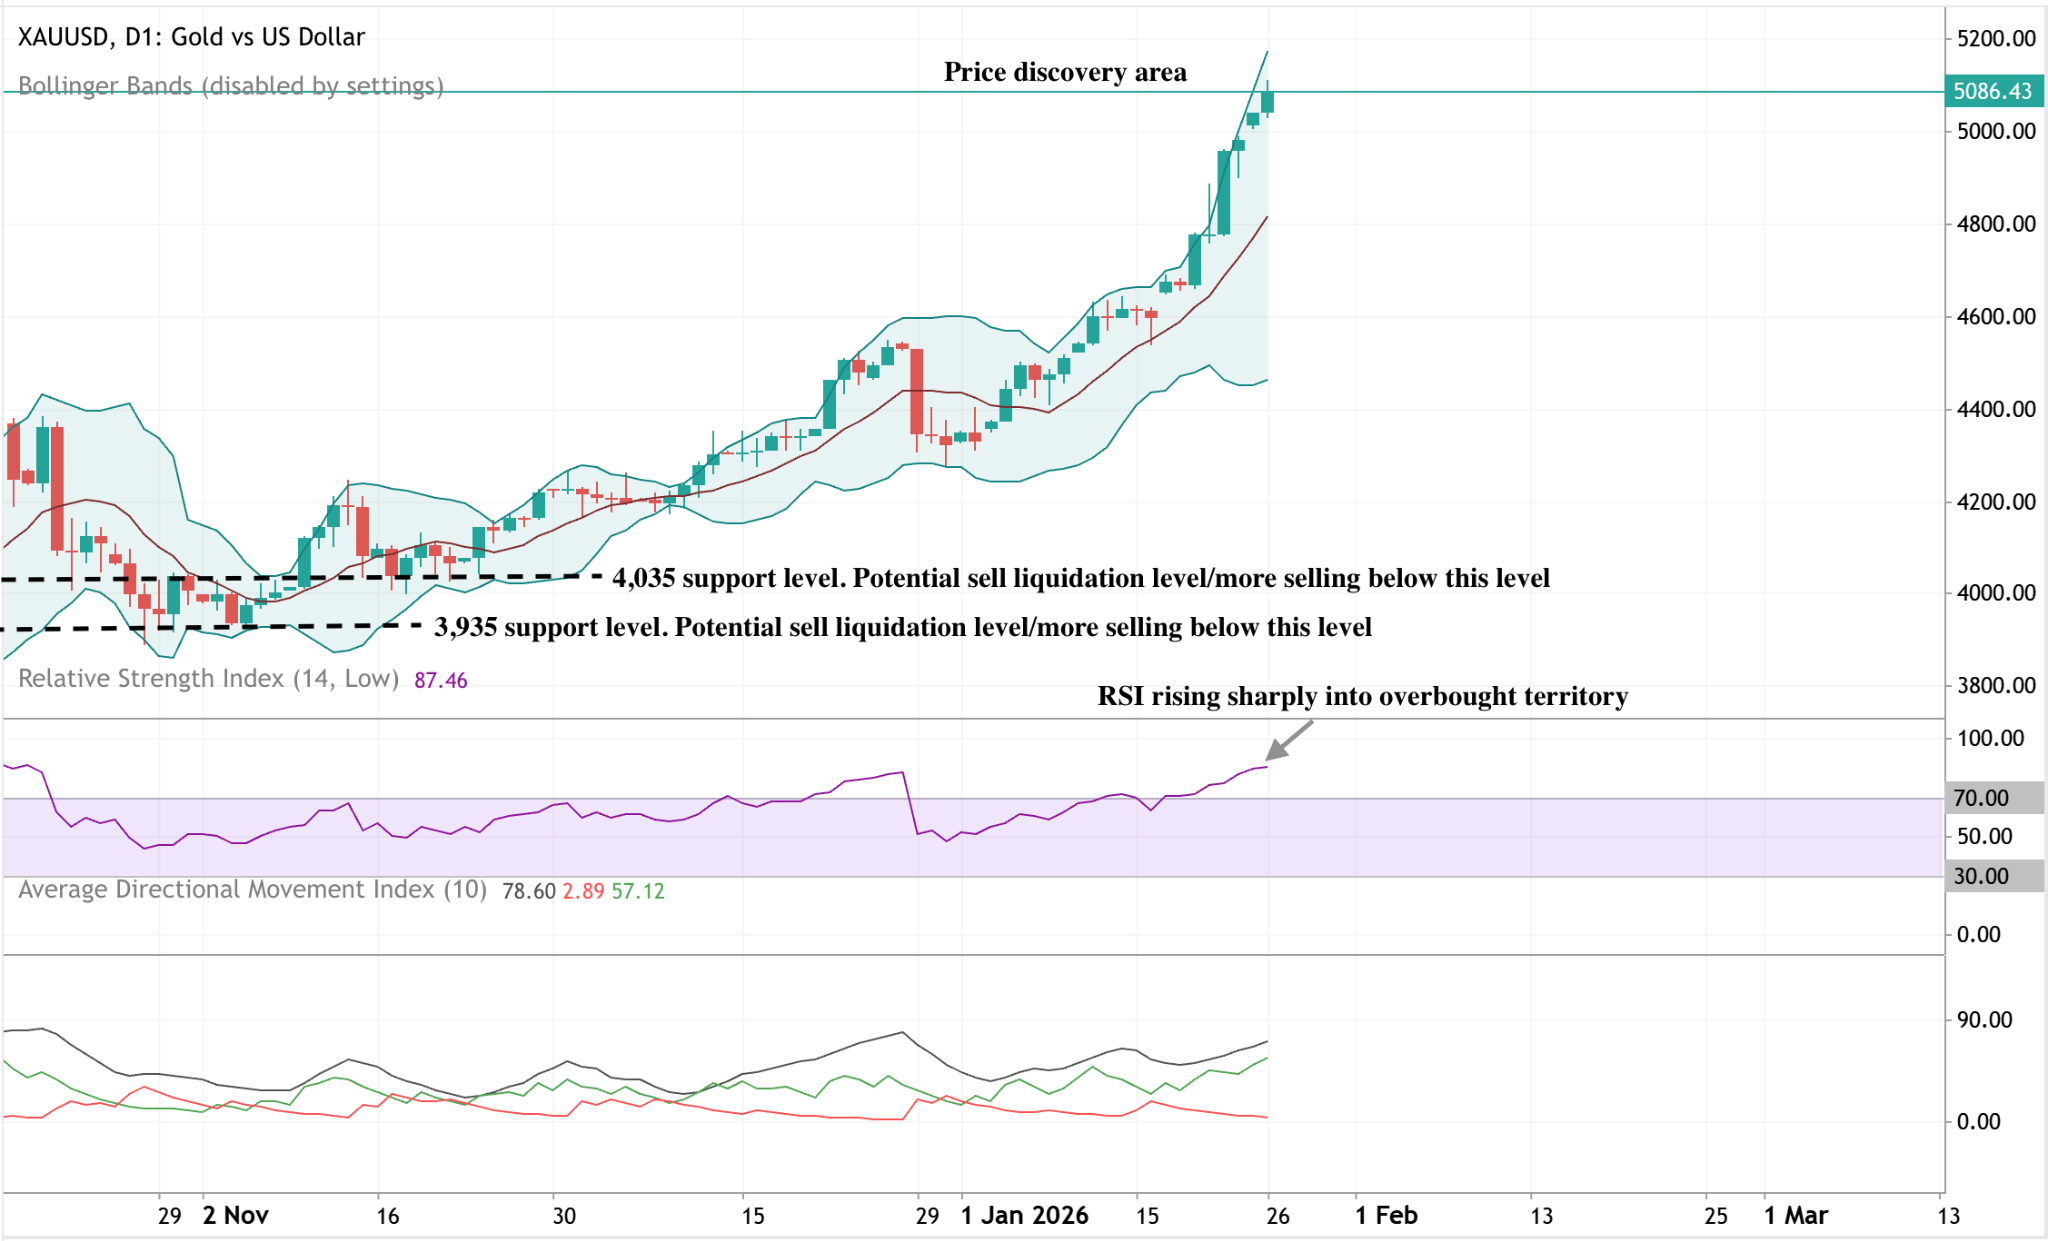
Gold technical outlook
Gold has decisively moved into price discovery, extending above $5,000 and trading along the upper Bollinger Band. The sustained expansion of the bands reflects elevated volatility and persistent directional momentum following the recent acceleration.
Momentum indicators signal extreme conditions, with RSI readings deep in overbought territory and the ADX at exceptionally high levels, suggesting a strong, mature trend phase. From a structural standpoint, the advance remains well above earlier consolidation zones around $4,035 and $3,935, emphasising the scale of the move. Overall, the chart depicts an extended momentum-driven environment characterised by high volatility, strong trend persistence, and active price discovery.
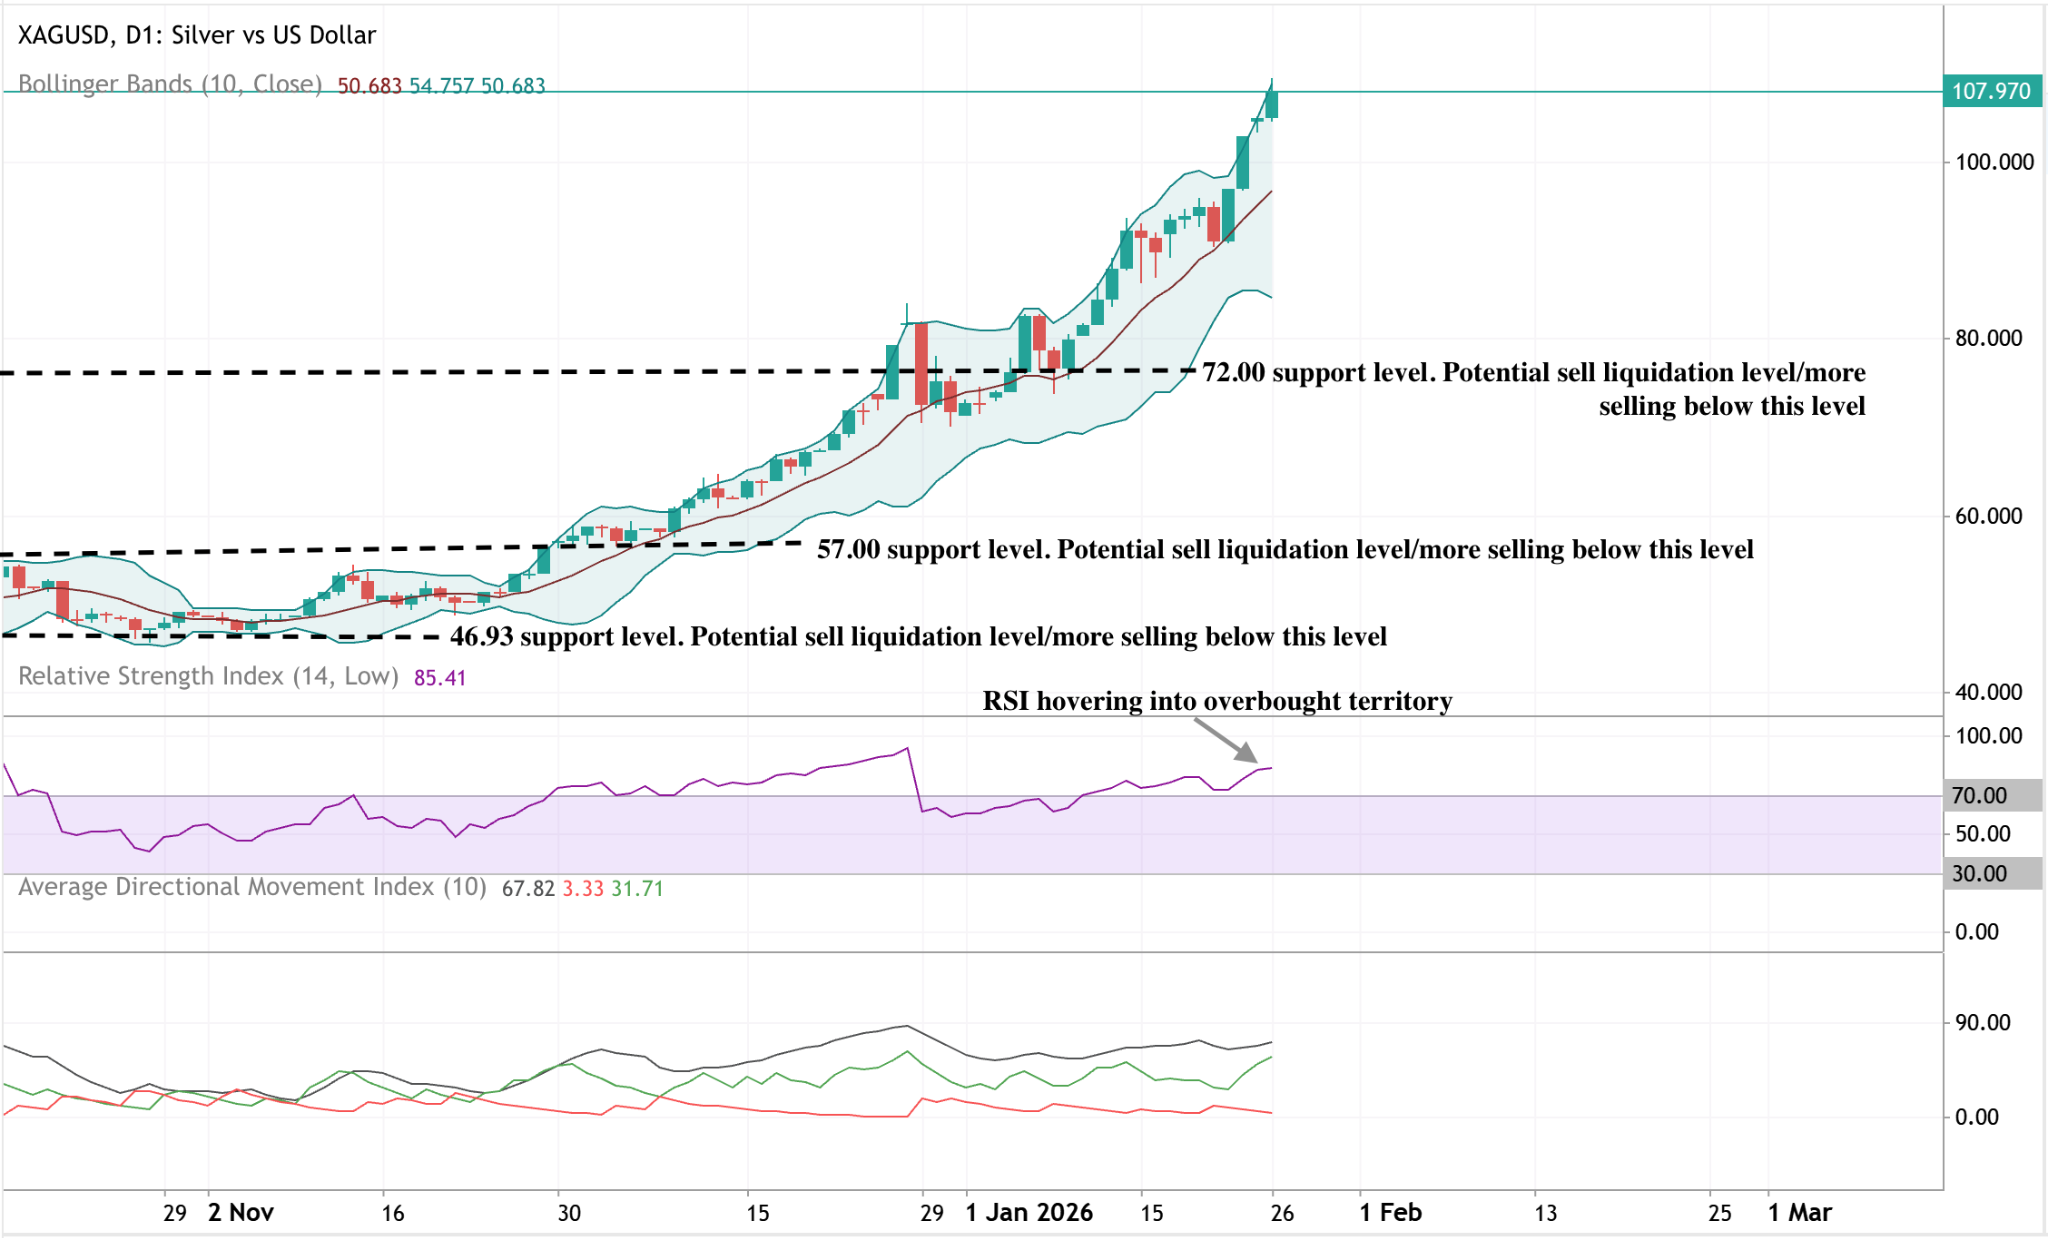
Silver technical outlook
Silver has extended sharply higher to fresh highs, trading near the upper Bollinger Band as volatility remains elevated. The Bollinger Bands are widely expanded, indicating sustained directional momentum rather than a low-volatility consolidation phase.
Momentum indicators show extreme conditions, with the RSI hovering deep in overbought territory, reflecting persistent upside pressure. Trend strength remains pronounced, with the ADX at elevated levels and directional indicators confirming a strong, mature trend environment.
From a structural perspective, the move has carried price well above earlier consolidation zones around $72, $57, and $46.93, highlighting the scale and persistence of the advance. Overall, the chart depicts an extended, momentum-driven phase characterised by strong trend continuation and heightened volatility.
The information contained on the Deriv Blog is for educational purposes only and is not intended as financial or investment advice. The information may become outdated, and some products or platforms mentioned may no longer be offered. We recommend you do your own research before making any trading decisions. The performance figures quoted are not a guarantee of future performance.


