Gold price crash: Is this a mega pause before the next leg up?

Analysts say gold’s historic crash looks less like the end of a rally and more like a mega pause before its next leg up. On Tuesday, the gold price plunged 5.7%, its biggest one-day fall since 2013, erasing $2.5 trillion in value from gold in just 24 hours. Despite the shock, experts note that the drivers behind gold’s record run remain intact - sticky inflation, central bank accumulation, and expectations of U.S. rate cuts.
Rather than marking the start of a bear market, the correction appears to be a healthy reset after a near-parabolic rise that pushed gold to record highs of $4,381 per ounce. The data suggests the market isn’t breaking down - it’s catching its breath.
Key takeaways
- Gold prices fell 5.7% in a day, marking the largest single-session decline since 2013, while silver dropped 9%, its biggest daily fall since the 2020 crash.
- The combined loss in gold and silver market value neared $3 trillion in 24 hours.
- The fall came after a record nine-week rally, during which gold hit an all-time high of $4,381 per ounce.
- Gold’s RSI hit 91.8 - the highest in recorded history - signalling extreme overbought conditions before the selloff.
- Even after the drop, gold remains up more than 55% YTD, supported by inflation, central bank demand, and expectations of rate cuts.
The run-up: When gold and silver hit record highs
Before the crash, gold was in uncharted territory. Prices surged to $4,381.21, fuelled by strong ETF inflows, geopolitical tension, and expectations that the U.S. Federal Reserve would soon begin cutting interest rates. Silver, meanwhile, soared to an 70% YTD gain, its best performance in more than four decades.
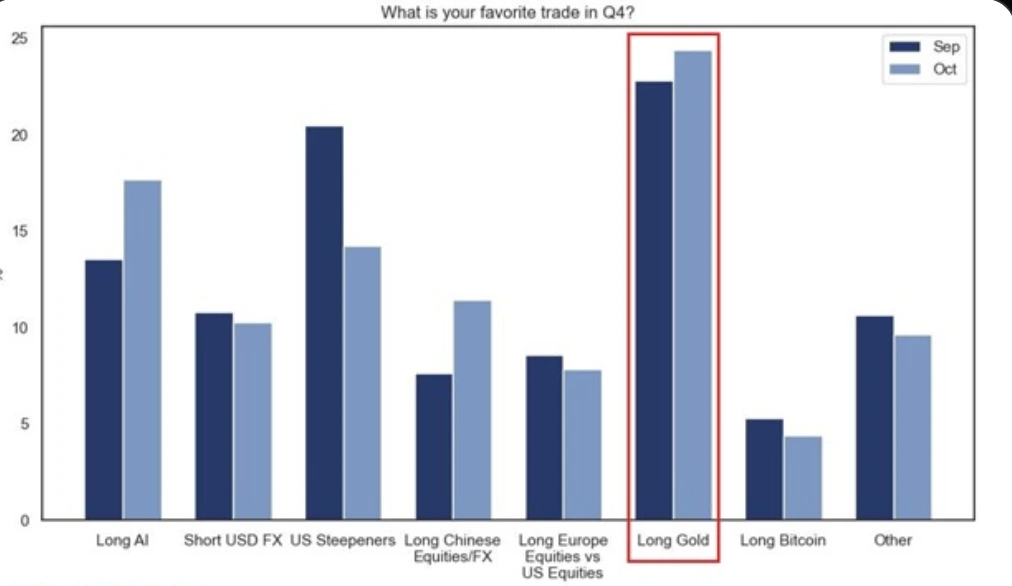
Both metals had become the year’s standout performers, far outpacing tech equities and AI-linked stocks. In fact, a Goldman Sachs investor survey found that 25% of institutional investors ranked “long gold” as their favourite trade - higher than “long AI stocks” (18%).
The rally was relentless. Gold had notched nine consecutive weekly gains, only the fifth time in history this had happened. Each of the previous four streaks ended with corrections averaging 13% within two months. According to analysts, the pullback was overdue, and the market finally delivered it.
The drop: When record highs met gravity
Gold’s sharp reversal was the product of multiple overlapping forces converging in a single trading session. After months of relentless gains, many traders began to take profits ahead of the long-delayed release of the U.S. Consumer Price Index (CPI).
The rally had been so steep that speculative long positions had reached multi-year highs, leaving the market vulnerable to any trigger. When some large investors started booking profits, algorithmic models and leveraged traders quickly followed, turning what began as a mild pullback into a cascade of selling.
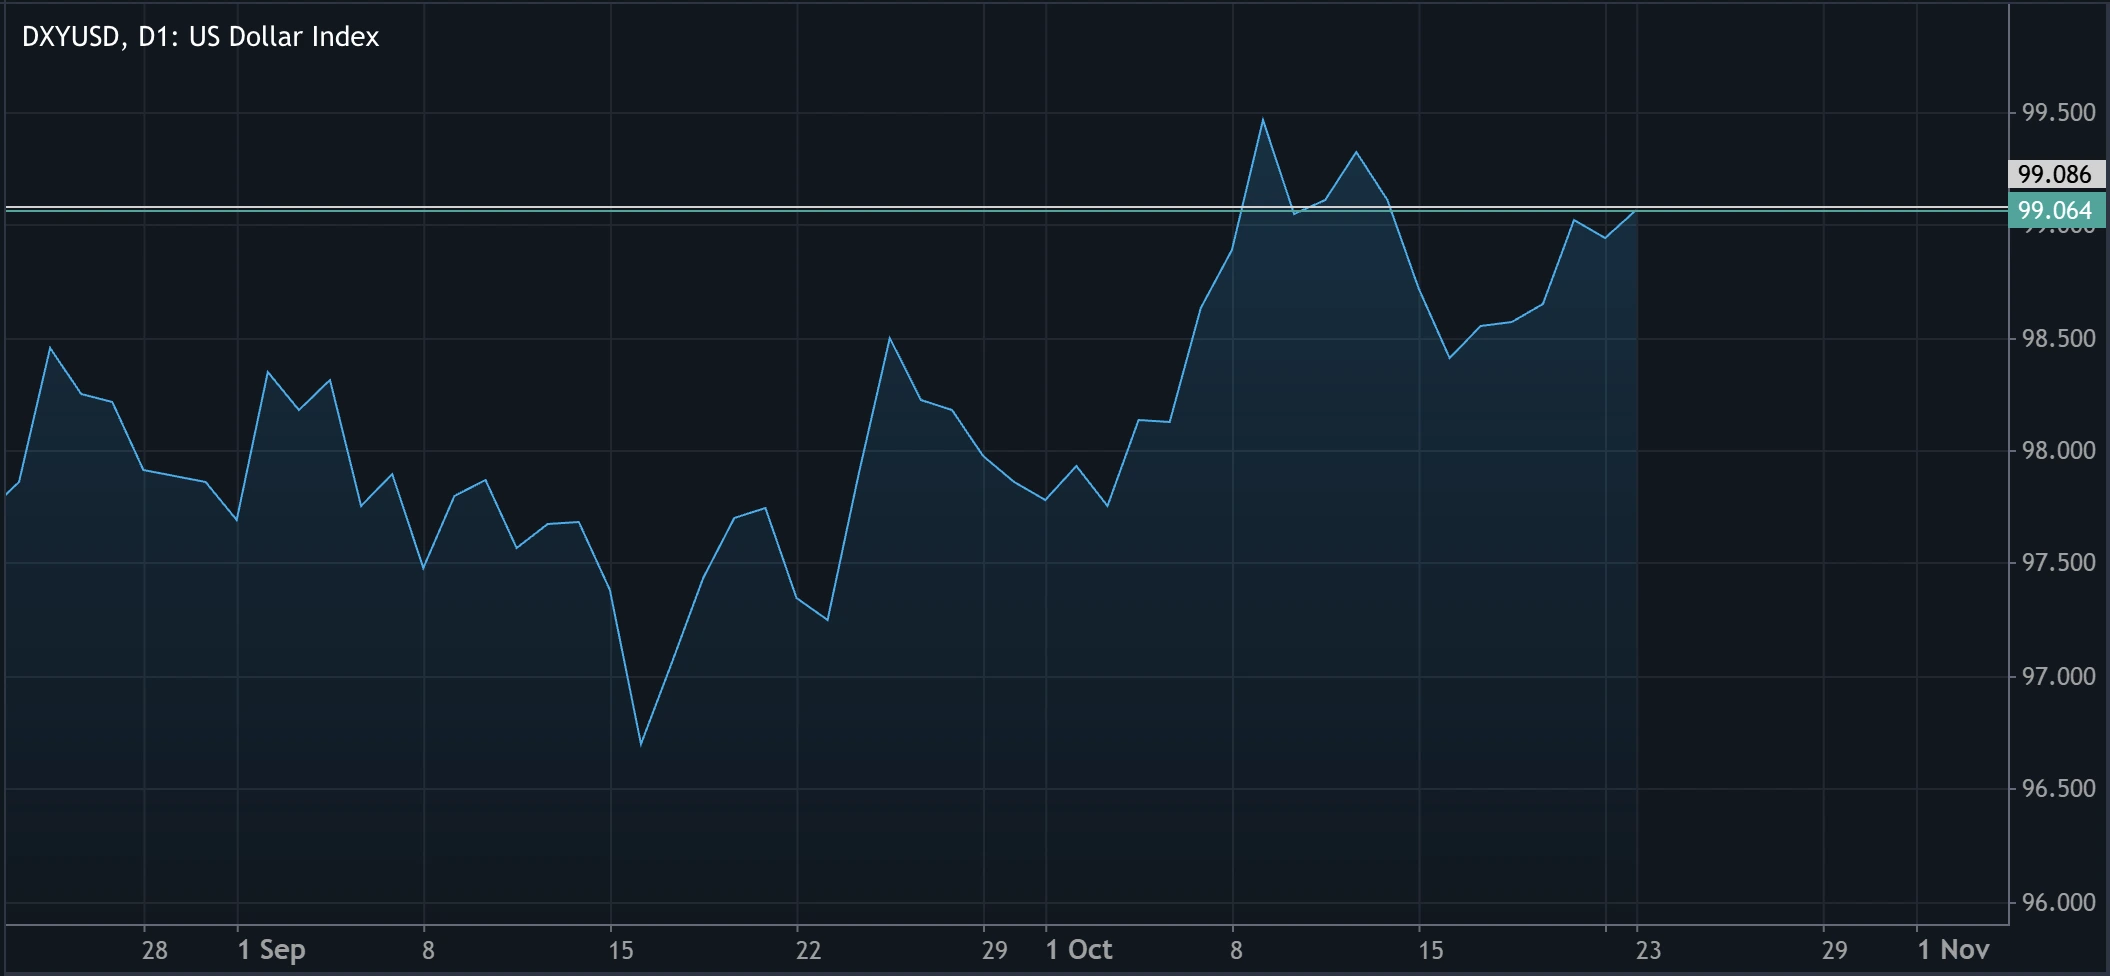
At the same time, the U.S. dollar staged a rebound. Because gold is priced in dollars, a stronger dollar automatically makes the metal more expensive for non-U.S. buyers, curbing demand. The timing of the dollar’s surge during the selloff only deepened the downward momentum.
Adding to the pressure, a brief shift in global sentiment reduced the appetite for safe-haven assets. Renewed optimism over trade diplomacy between Washington and Beijing, coupled with reports of upcoming meetings between President Donald Trump and Chinese President Xi Jinping, eased geopolitical tension.
Trump’s remark that he expected to “work out a very fair deal with President Xi of China” sparked a modest return to risk-taking, leading investors to rotate back into equities and away from defensive assets like gold.
Meanwhile, seasonal factors added another layer of weakness. The end of India’s Diwali festival - one of the peak periods for physical gold buying - resulted in a temporary lull in demand from the world’s second-largest consumer. That decline in physical purchases coincided with the speculative unwinding in futures markets, amplifying the price pressure.
Gold technical insights
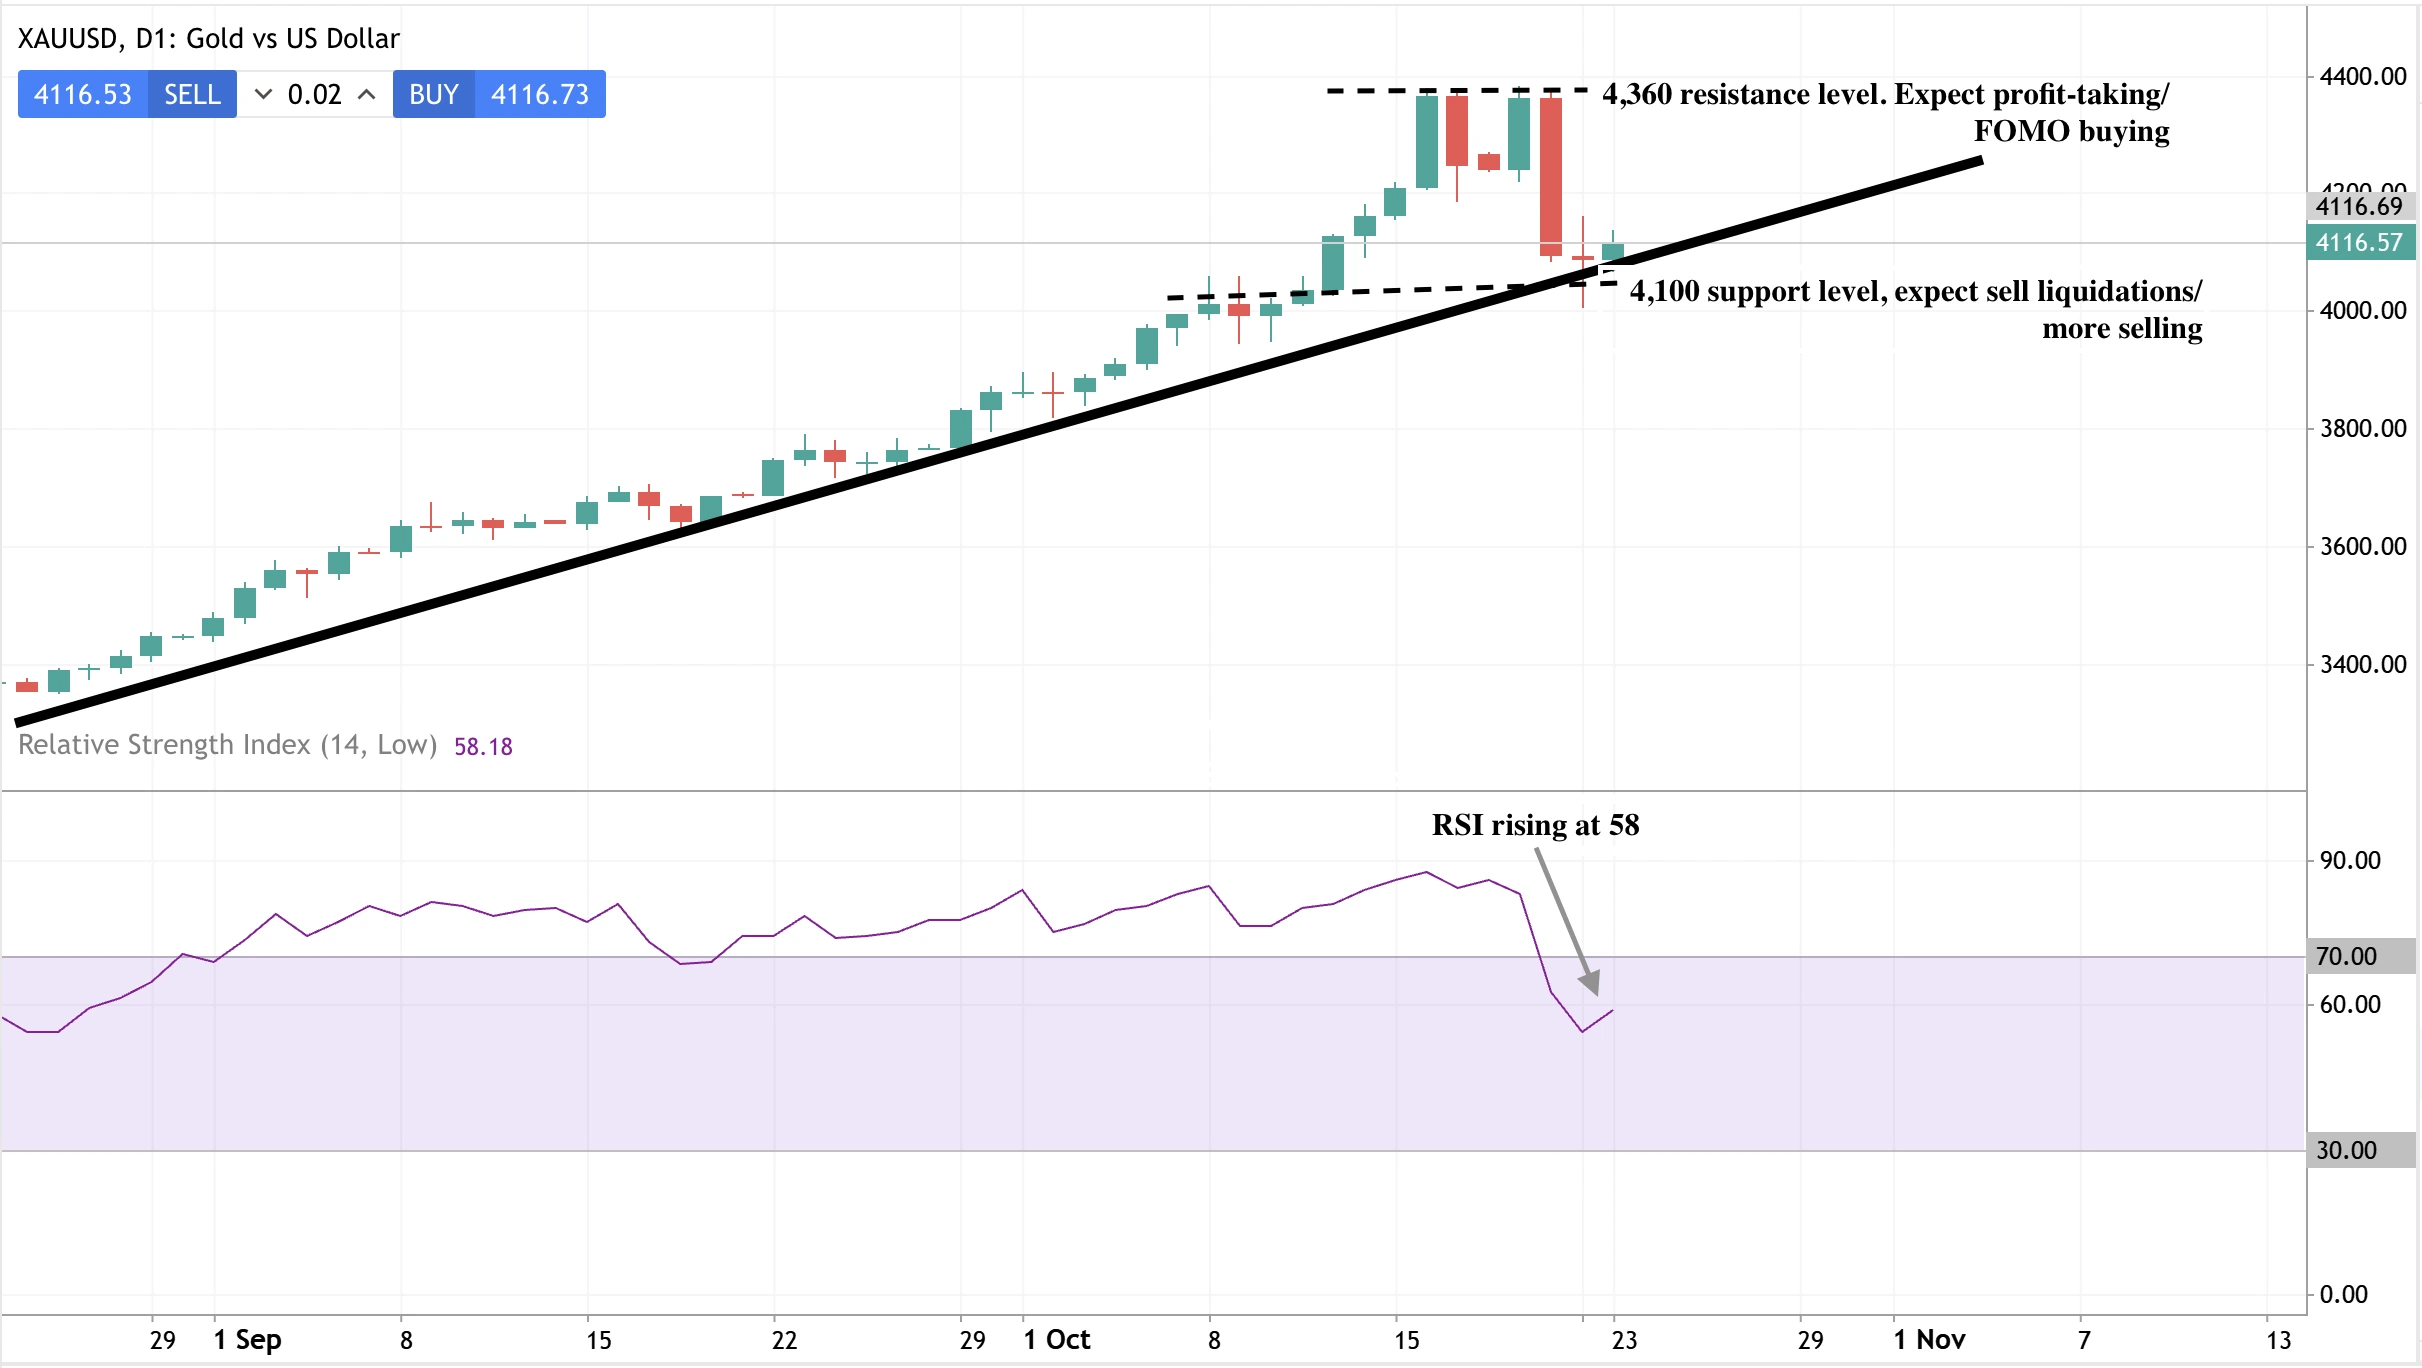
Gold remains in a firm uptrend, supported by a rising trendline connecting recent swing lows on the daily chart. After a sharp pullback from recent highs above $4,300, prices have retraced to test this key trendline support around $4,100–$4,120. The rejection wick near this level suggests buyers are stepping in to defend the uptrend.
The RSI (14) currently hovers near 58, indicating that momentum remains positive but has cooled from overbought territory - a sign of a healthy correction within a broader bullish trend. As long as the RSI stays above 50 and the trendline holds, the outlook favours a continuation toward the $4,300 region.
A daily close below the trendline, however, would signal weakening momentum and open the door for a deeper retracement toward $4,000.
Bias: Bullish above $4,100 towards $4,360 resistance level; neutral-to-bearish if price breaks below the trendline.
The rarity of the move
A 4.5-sigma event means such a large move should only happen once every 240,000 trading days - essentially once in a millennium in statistical terms. In reality, since 1971, gold has seen declines of this magnitude only 34 times out of 13,088 trading days, or roughly 0.26% of the time, according to data compiled by Burggraben Holdings.
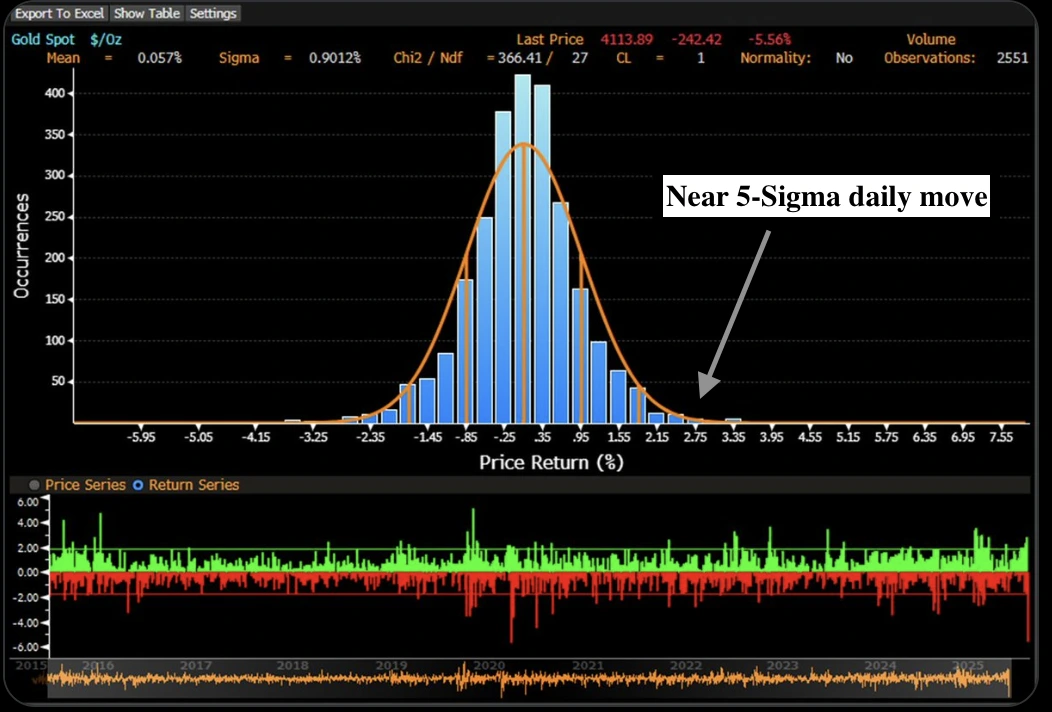
That makes the October 2025 drop one of the rarest events in modern market history. Yet, paradoxically, it occurred at a moment of maximum optimism - right after gold’s strongest rally since the 1970s.
Why fundamentals remain strong
Despite the dramatic correction, gold’s underlying fundamentals have not deteriorated - in fact, several have improved:
Inflation remains sticky
Alternative inflation trackers show U.S. inflation rising to 2.6%, marking the fifth consecutive monthly increase despite official data delays from the government shutdown.
Rate cuts are priced in
Traders have nearly fully priced in a 25-basis-point rate cut at the next Federal Reserve meeting. Lower rates generally weaken the dollar and reduce the opportunity cost of holding non-yielding assets like gold.
Central banks keep buying
Central banks have aggressively stockpiled gold throughout 2025, diversifying away from the dollar amid geopolitical uncertainty. Their purchases have shown no sign of slowing, even as prices dipped.
Institutional demand remains robust
Large funds and ETFs continue to report inflows into gold-backed products, suggesting that long-term investors are treating this correction as a buying opportunity, not an exit signal.
The geopolitical backdrop is still fragile
Even as trade tensions ease, global uncertainty persists. Negotiations involving the U.S., China, and Russia - including a potential Trump-Putin summit - could inject volatility back into markets, supporting safe-haven flows.
Market outlook: volatility before recovery
After peaking at $4,381, gold slid to around $4,000 per ounce, testing key support levels. Traders using Deriv MT5 or Deriv cTrader can monitor these key zones directly on live charts and manage positions through advanced technical indicators.
Citigroup downgraded its stance on gold from overweight to neutral, warning that positioning had become crowded. It expects prices to consolidate around $4,000 in the coming weeks.
Saxo Bank’s Ole Hansen, however, maintains a bullish long-term outlook, saying, “This correction was much-needed - the developments that drove this rally haven’t gone away.”
ING analysts echoed this sentiment, noting that the selloff was “largely technical,” a natural cool-off in a market that had become “hugely overbought.”
Silver, meanwhile, continues to show higher volatility - falling 9% during the crash but remaining up 67% YTD. Once broader market stability returns, analysts expect silver to rebound faster due to its dual role as an industrial and monetary metal.
Gold price prediction 2025
For traders, this correction offers both risk and opportunity.
Short-term strategy
Volatility will remain high. Watch for price stabilisation near $4,000–$4,050 as a potential accumulation zone. Use Deriv’s Trading Calculator to measure potential margin and profit before entering any position.
Medium-term outlook
Fundamentals still favour gold. Rate cuts, persistent inflation, and sustained central bank demand point to renewed upside momentum once the market digests recent gains.
Silver exposure
Silver’s sharper decline may present an attractive entry for traders willing to tolerate volatility. Historically, silver tends to rebound more aggressively after major gold-led corrections.
For now, this “historic crash” appears less like the start of a bear market and more like the pause before gold’s next leg up - a consolidation phase before the world’s oldest safe-haven asset resumes its climb toward new highs.
The performance figures quoted are not a guarantee of future performance.


