Bitcoin's redemption arc: Can the $90,000 breakout really hold?

Bitcoin’s redemption arc has arrived in full view as the world’s largest cryptocurrency claws back above $90,000, raising the question of whether this breakout can truly hold. The move follows a sharp rebound from the ~$80,400 trough seen only days earlier, driven largely by rising expectations that the Federal Reserve may cut rates in December and a broader shift back toward risk assets, according to reports.
Yet Bitcoin’s rally sits on fragile ground, with spot ETFs still experiencing weak inflows and month-on-month performance showing BTC down nearly 19%, underscoring the uneven footing behind the bounce.
Analysts expressed that this tension between renewed optimism and deteriorating liquidity now defines the market’s mood. If Bitcoin is to transform this recovery into something durable, it must overcome stiff resistance in the $92,000–$95,000 zone and attract a decisive return of retail volume and ETF participation. Whether those conditions emerge - or whether the breakout fades into another corrective downswing - will determine the next chapter in Bitcoin’s so-called redemption arc.
What’s driving Bitcoin’s latest move
Bitcoin’s latest ascent has been powered in part by shifting macro expectations. Traders are now assigning higher odds to a December Federal Reserve rate cut, which is helping fuel a rebound in risk appetite across equities and cryptocurrency markets.
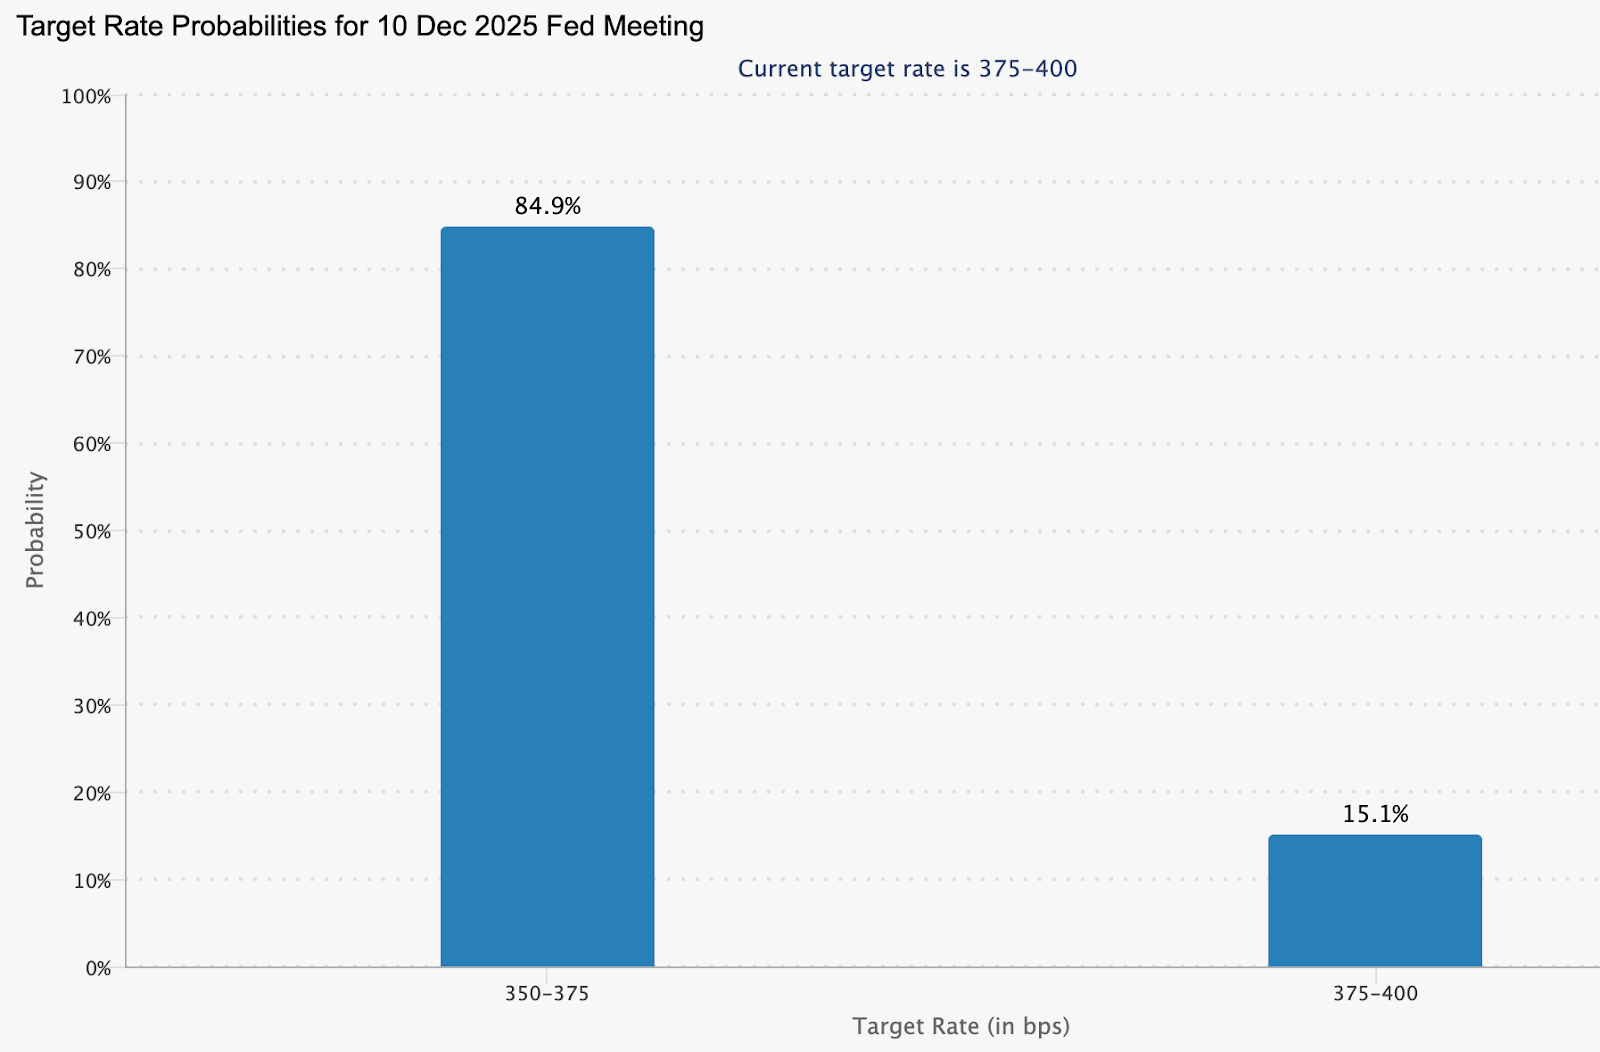
This shift in sentiment helped BTC reclaim the $90,000 handle after falling to the $80,000 region last week. Yet the backdrop is more complicated: inflation remains elevated, prompting analysts at QCP Capital to caution that “supply is likely to cap BTC in the mid-$90Ks,” suggesting the rally may be nearing exhaustion.
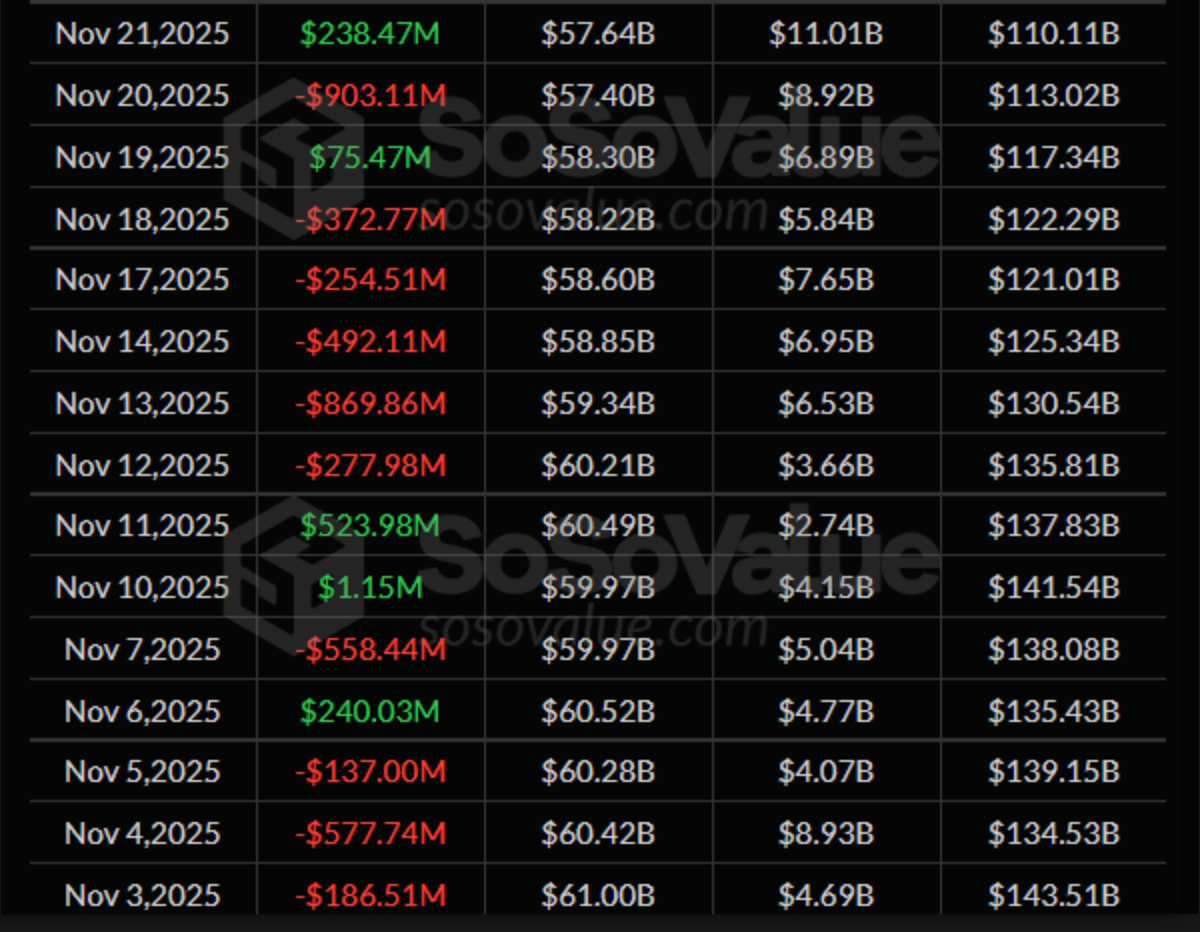
The ETF landscape adds another layer. After weeks of record outflows, U.S. bitcoin ETFs have struggled to attract consistent inflows. Analysts note that liquidity remains thin, and investor demand remains hesitant.
MicroStrategy - one of Bitcoin’s largest corporate holders - has only just neared break-even levels and is now on MSCI’s delisting watchlist, amplifying uncertainty over institutional exposure. These stresses remain beneath the surface, even as prices recover, revealing a rally built more on macro positioning than strong capital inflows.
Why it matters
The divergence between price action and structural metrics has become a focal point for investors. Torsten Slok, chief economist at Apollo, notes that Bitcoin’s typical correlation with the Nasdaq has weakened in recent weeks, as BTC has declined more rapidly than major tech benchmarks.

This decoupling raises questions about crypto-specific liquidity issues at a time when equities are stabilising. Meanwhile, analysts at 10X Research warn the market may be placing too much faith in a December rate cut. Their work suggests that Bitcoin reacts more to the Fed’s communication and tone than to actual policy moves.
If Powell signals caution or downplays the pace of future easing, markets could reverse quickly. The firm also challenges assumptions around Treasury General Account (TGA) spending as a catalyst for crypto liquidity, noting that previous TGA releases took up to two months to filter into Bitcoin’s price - if at all.
Impact on industry, markets, and consumers
Recent data revealed, Bitcoin’s move back above $90,000 may have restored some psychological confidence, but the structural picture remains uneven. The asset is still down 5% year-to-date, and ETF products only recently stabilised after heavy outflows that contributed to BTC’s fall to around $80K. The rebound has offered relief, but the market is far from signalling a clean upward trend.
Institutional flows offer glimmers of a shift. VALR CEO Farzam Ehsani said spot ETFs saw inflows on Tuesday for the first time in weeks - “an early sign that institutional liquidity is returning.” Traders monitoring price behavior through Deriv MT5 have noted the importance of $90,000 as a structural pivot, with shorter timeframes showing volatility between bullish attempts and profit-taking waves. Meanwhile, the Deriv trading calculator has become increasingly useful for traders looking to estimate position costs and risk as BTC flirts with major resistance.
According to market watchers, Bitcoin’s performance continues to influence the broader digital asset complex. A decisive hold above $ 90,000 could boost liquidity across altcoin and stablecoin markets. A breakdown of risks could reignite forced selling and erode confidence across the sector.
Expert outlook
QCP Capital sees a clear resistance band forming between $92,000 and $95,000, warning that shrinking liquidity could limit any attempt to push higher. They identify the $80,000 –$82,000 range as a crucial support area that buyers defended during the latest sell-off. Analysts at 10X Research add that if historical TGA-liquidity lags hold, Bitcoin may consolidate into late January 2026, reducing the odds of a swift breakout.
Not all strategists believe a bottom has been reached. Compass Point analyst Ed Engel argues that bear markets often feature “swift relief rallies followed by aggressive selling into strength.” He wants to see net accumulation from long-term holders and more assertive short-positioning in futures markets before turning constructive. Without these signals, Engel identifies a risk that BTC may encounter heavy resistance if it approaches $92,000-$95,000, potentially triggering a renewed downturn.
Key takeaway
Analysts note, Bitcoin’s climb back above $90,000 marks a symbolic turning point in its ongoing redemption arc, but the foundations of this rally remain thin. Resistance near $92,000 –$95,000, weak ETF inflows, and a historically fragile year-end liquidity backdrop all challenge the sustainability of the breakout.
The next phase will depend on how markets digest the Fed's December messaging, whether retail traders return, and whether institutional inflows strengthen. These forces will determine whether Bitcoin’s revival continues - or stalls at familiar resistance.
Bitcoin technical insights
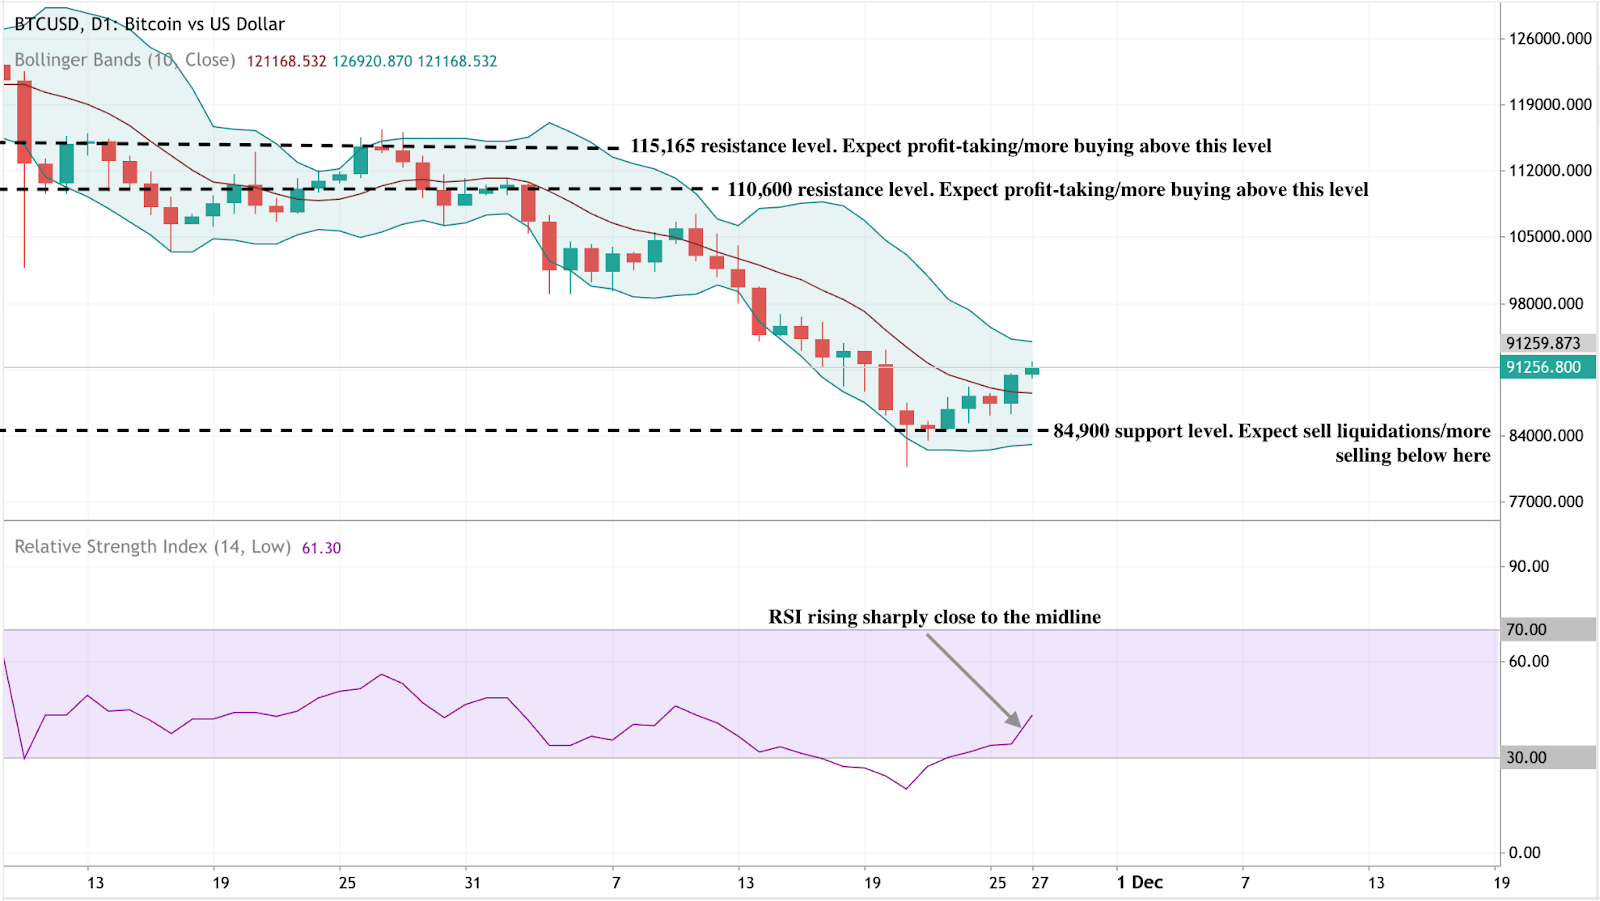
At the start of writing, Bitcoin (BTC/USD) is attempting a recovery from recent lows, trading just above $91,200 after rebounding from the key $84,900 support zone. Holding this level is crucial - a break below it could trigger sell liquidations and reopen the downside trend. On the upside, BTC now faces two important resistance levels: $110,600 and $115,165, where traders may look for profit-taking or renewed buying interest if price can build enough momentum to retest them.
Price action remains contained within the Bollinger Bands, with BTC beginning to push toward the middle band after a prolonged period of weakness. This suggests early signs of stabilisation, though the broader trend still leans cautious until a clean breakout above the resistance zones.
The RSI has risen sharply to around 61, climbing back toward the midline after spending time in oversold conditions. This shift highlights improving bullish momentum, but with plenty of room before overbought levels are reached, suggesting the recovery could have more space to run if buyers continue to step in.
The performance figures quoted are not a guarantee of future performance.


