لماذا يشير الهبوط الأخير للبيتكوين إلى تحول في السيطرة على السوق

الانخفاض الأخير للبيتكوين لا يتعلق فقط بتراجع الأسعار - بل يعكس تغيرًا واضحًا في من يسيطر على السوق. أظهرت البيانات أن أكبر عملة مشفرة في العالم انخفضت بأكثر من 40٪ من أعلى مستوى لها في أكتوبر فوق 126,000 دولار، وانخفضت مؤقتًا إلى ما دون 73,000 دولار هذا الأسبوع، وهو أدنى مستوى لها منذ نوفمبر 2024.
الأهم من ذلك، أن البيتكوين انخفض الآن دون متوسط السعر الحقيقي للسوق (True Market Mean Price)، وفقًا للمحللين، وهو عتبة تقييم تفصل تاريخيًا بين الأسواق التي يقودها المشترون وتلك التي يهيمن عليها البائعون.
يأتي هذا الانهيار في الوقت الذي يبتعد فيه المستثمرون العالميون عن المخاطرة وسط عمليات بيع في الأسهم مدفوعة بالذكاء الاصطناعي وتصاعد التوترات الجيوسياسية. مع ارتفاع الذهب بنحو 7٪ في جلسة واحدة وارتفاع التقلبات عبر فئات الأصول، يشير سلوك البيتكوين إلى أن قيادة السوق تنتقل بعيدًا عن المشترين نحو البائعين - وهو انتقال قد يشكل حركة الأسعار للأشهر القادمة.
ما الذي يدفع هبوط البيتكوين الأخير؟
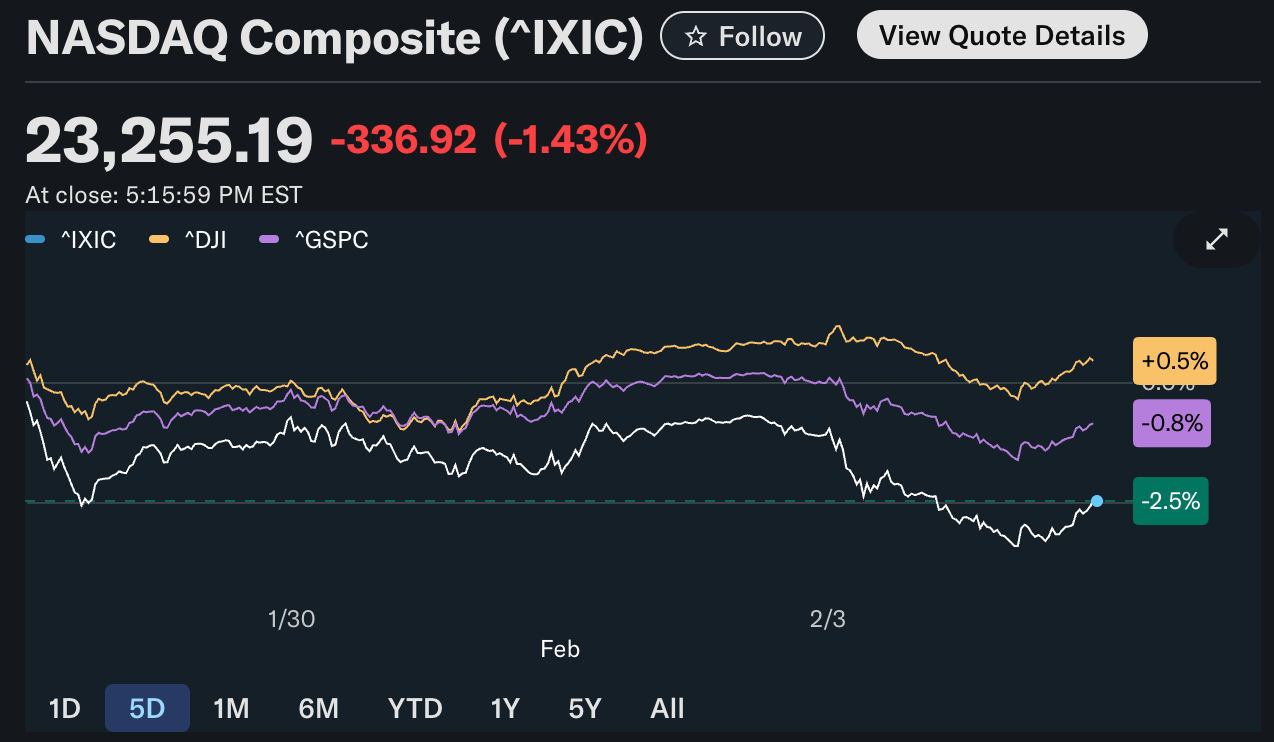
جاء تراجع البيتكوين بالتزامن مع موجة تجنب المخاطر الأوسع في الأسواق المالية. تعثرت الأسهم الأمريكية مع تراجع الثقة في تداولات الذكاء الاصطناعي، حيث انخفض مؤشر Nasdaq بنسبة 1.4٪ وتعرضت أسهم التكنولوجيا الكبرى لموجة بيع حادة.
أدى نمو الحوسبة السحابية المخيب للآمال من Microsoft، إلى جانب ارتفاع تكاليف الاستثمار في الذكاء الاصطناعي، إلى تجدد المخاوف من أن تقييمات قطاع التكنولوجيا قد تجاوزت الأرباح المستدامة.
ومع تراجع الأسهم، تبعت الأصول المضاربية نفس المسار. تم تداول البيتكوين بالتوازي مع أسهم التكنولوجيا عالية البيتا بدلاً من أن يكون وسيلة تحوط، مما عزز حساسيته لظروف السيولة. عندما يقلل المستثمرون من تعرضهم للمخاطر، غالبًا ما يتكبد البيتكوين خسائر كبيرة، خاصة خلال الفترات التي يظل فيها الرافعة المالية مرتفعة في أسواق مشتقات العملات المشفرة.
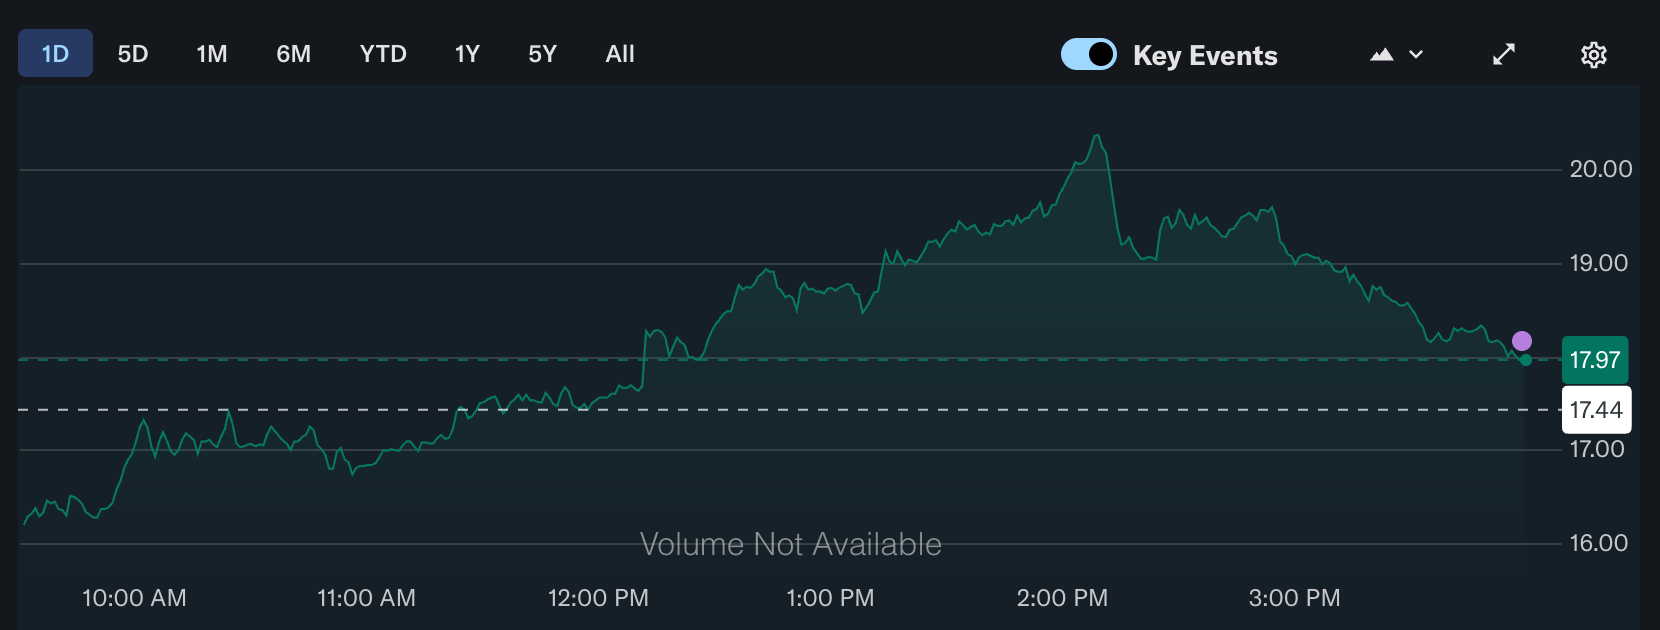
زادت التطورات الجيوسياسية من الضغط. فقد أفادت تقارير بأن الولايات المتحدة أسقطت طائرة إيرانية بدون طيار بالقرب من حاملة طائرات أمريكية، مما دفع مؤشر التقلب VIX للارتفاع مؤقتًا فوق 20، وهو مستوى يرتبط بزيادة التوتر في الأسواق.
انتقل رأس المال بسرعة إلى الملاذات الآمنة التقليدية، حيث سجل الذهب والفضة تحركات مزدوجة الرقم خلال الأسبوع، مما ترك البيتكوين في الجانب الخاسر من التمركز الدفاعي.
لماذا هذا مهم: كسر دون متوسط السوق الحقيقي
الإشارة الأهم من هذه الحركة هي هبوط البيتكوين دون متوسط السعر الحقيقي للسوق، والذي يُقدر حاليًا بالقرب من 80,000 دولار.
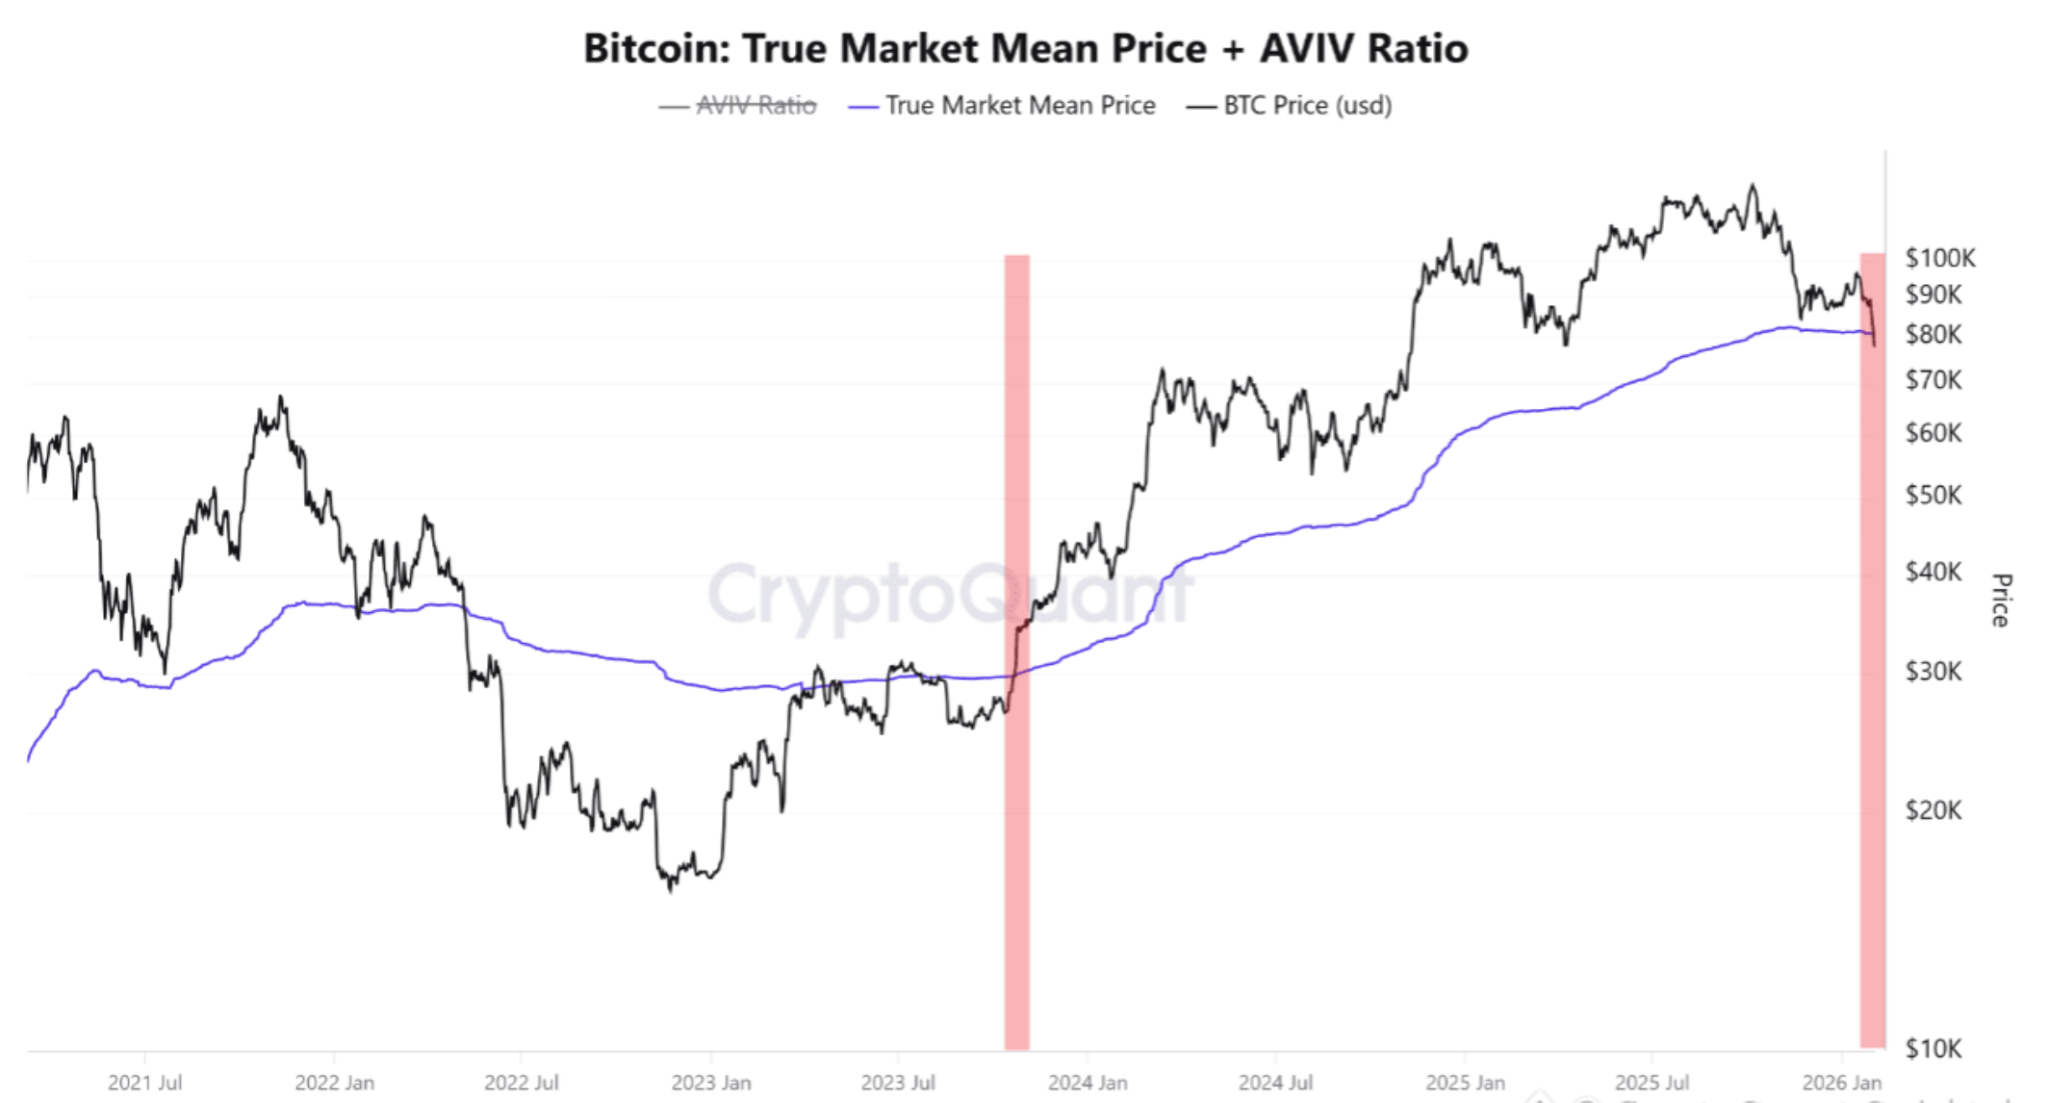
يعكس هذا المقياس متوسط التكلفة التاريخية لجميع حاملي البيتكوين، ويُستخدم على نطاق واسع لتقييم ما إذا كان غالبية المستثمرين يحققون أرباحًا أم خسائر. عندما تبقى الأسعار فوق هذا المستوى، عادة ما يحتفظ المشترون بالسيطرة. وعندما تنخفض الأسعار دونه، غالبًا ما تزداد ضغوط البيع.
في الدورات السابقة، كان هذا التحول علامة على تغيير في نظام السوق. خلال تراجع 2022، سبق إغلاق البيتكوين الأسبوعي دون هذا المقياس انخفاضًا استمر سبعة أشهر أدى في النهاية إلى هبوط الأسعار بأكثر من 55٪. وبينما تختلف الظروف الحالية، إلا أن الاستجابة السلوكية متشابهة: يصبح الحاملون الخاسرون أكثر ميلاً لبيع الارتفاعات، مما يحد من الزخم الصعودي.
أشار جيري أوشي، رئيس قسم الرؤى السوقية العالمية في Hashdex، إلى أن تباعد البيتكوين عن الذهب يعكس كيف ينظر المستثمرون حاليًا إلى المخاطر. فقد تفوق الذهب الآن على البيتكوين خلال السنوات الخمس الماضية، مما يشير إلى أن الأسواق لا تزال تفضل المخازن التقليدية للقيمة خلال فترات عدم اليقين الاقتصادي الكلي. ويعد هذا التحول في التفضيل مهمًا عند تقييم من يمتلك قوة التسعير.
تأثير ذلك على أسواق العملات المشفرة والمستثمرين
كان التأثير الفوري واضحًا عبر سوق العملات المشفرة. فقد أدى الانخفاض الحاد للبيتكوين خلال اليوم إلى تصفية مراكز الرافعة المالية، مما سرّع من التحركات الهبوطية وسحب العملات البديلة الرئيسية إلى الأسفل. عندما تنتقل السيطرة في السوق إلى البائعين، تميل التقلبات إلى الارتفاع مع تضخيم السيولة الضعيفة لتقلبات الأسعار.
بالنسبة للمستثمرين الأفراد، فإن التداعيات أكثر هيكلية. فقد دخل العديد من المشاركين خلال موجة الصعود في أواخر 2024، مما يعني أن حصة متزايدة من الحاملين يجلسون الآن على خسائر غير محققة. تاريخيًا، يقلل ذلك من شهية المخاطرة ويؤخر التعافي، حيث يستغرق بناء الثقة وقتًا. كما أصبحت التدفقات المؤسسية أكثر انتقائية، حيث يفضل المستثمرون السلع والأصول الدفاعية على العملات الرقمية في البيئة الحالية.
توقعات الخبراء: ماذا سيحدث بعد ذلك
بالنظر إلى المستقبل، يتوقع المحللون أن يظل البيتكوين متقلبًا بينما يبحث السوق عن توازن جديد. عدم اليقين التنظيمي، وعدم الاستقرار الاقتصادي الكلي، وتشديد الأوضاع المالية كلها تحد من احتمالية حدوث انتعاش سريع. ويتوقع أوشي استمرار التقلبات على المدى القريب مع استمرار تكامل العملات المشفرة في البنية التحتية المالية التقليدية، حتى مع بقاء اتجاهات التبني طويلة الأجل قائمة.
تشير التجارب السابقة إلى أن الانخفاضات دون المقاييس الرئيسية للتقييم نادرًا ما تُحل بسرعة. وبدلاً من ذلك، غالبًا ما تدخل الأسواق في مرحلة مطولة من التماسك أو التراجع التدريجي مع خروج الأيدي الضعيفة وتراكم الحاملين الأقوى. وخلال الأشهر الثلاثة إلى الستة القادمة، ستتم مراقبة قدرة البيتكوين على استعادة مستوى 80,000 دولار عن كثب كمؤشر على ما إذا كان المشترون قادرين على استعادة السيطرة أم أن ميزان القوى سيظل بقوة في يد البائعين.
الخلاصة الرئيسية
يشير الهبوط الأخير للبيتكوين إلى أكثر من مجرد ضعف قصير الأجل - بل يدل على تحول في السيطرة على السوق بعيدًا عن المشترين ونحو البائعين. ومع تلاشي شهية المخاطرة عبر الأسواق العالمية، تتصرف العملات المشفرة بشكل أقل كأداة تحوط وأكثر كأصل مضاربي. من المرجح أن تحدد الأشهر القليلة القادمة ما إذا كانت هذه الحركة ستصبح إعادة ضبط مطولة أم قاعدة للانتعاش. في الوقت الحالي، يظل الصبر والوعي بالمخاطر أمرين حاسمين.
التوقعات الفنية للبيتكوين
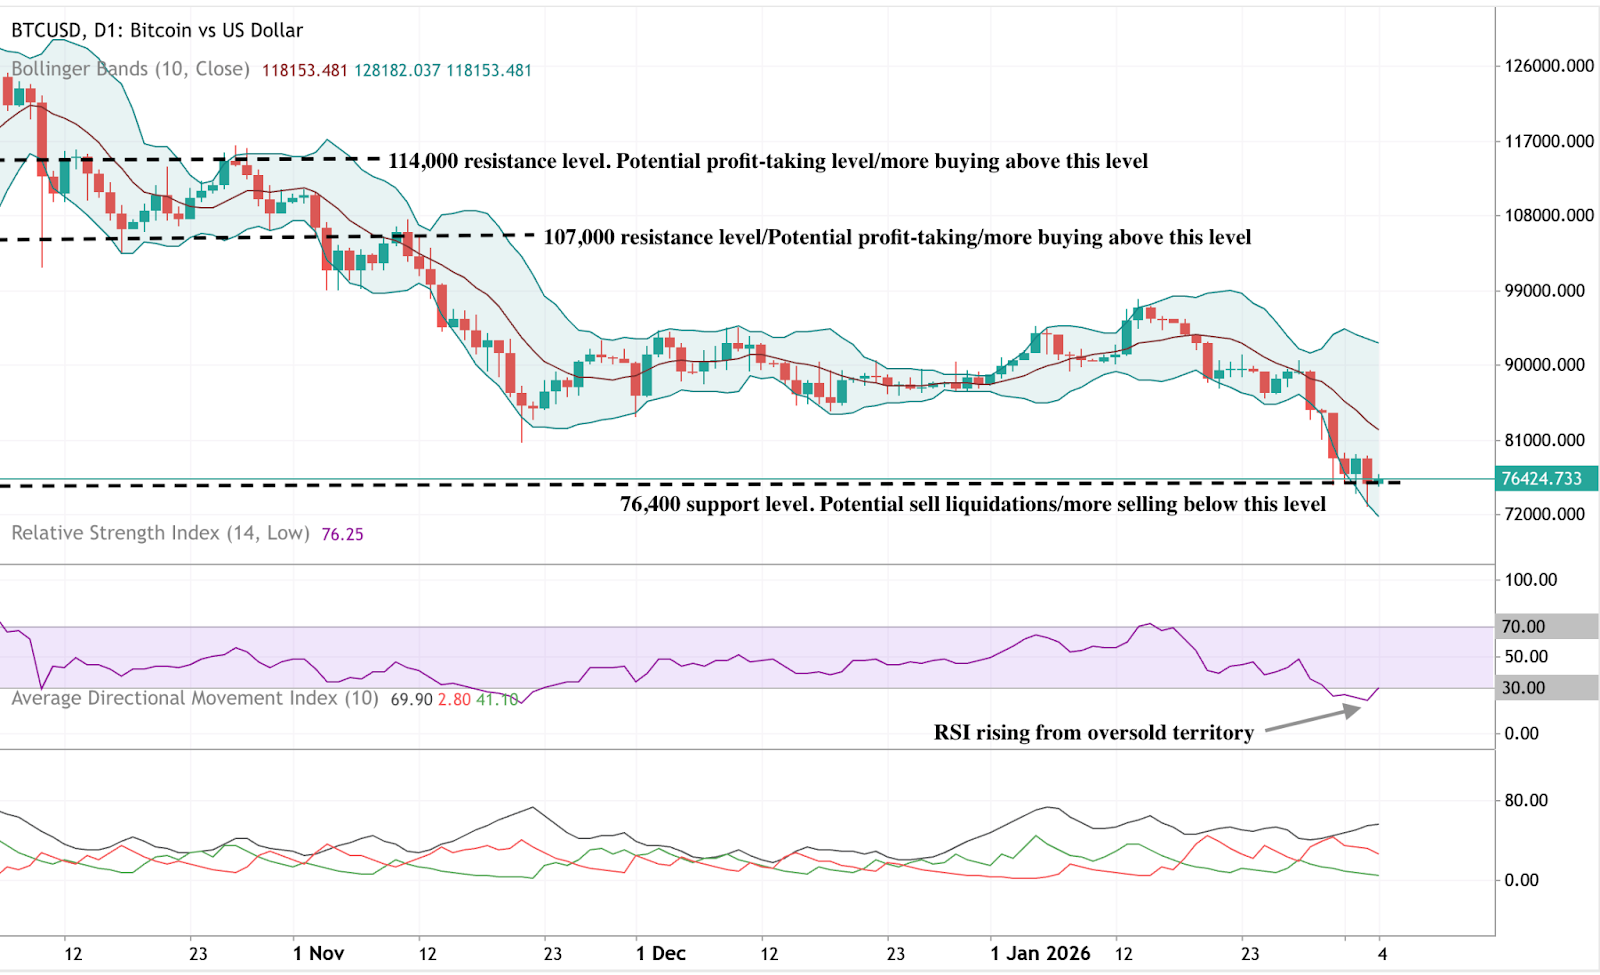
واصل البيتكوين التحرك هبوطًا ضمن هيكله الأوسع، حيث انخفض السعر دون الحد السفلي لـ Bollinger Band قبل أن يستقر بالقرب من 76,400 دولار. ولا تزال Bollinger Bands متسعة بشكل كبير، مما يشير إلى أن التقلب لا يزال مرتفعًا بعد التسارع الهبوطي الأخير.
تُظهر مؤشرات الزخم بوادر مبكرة على الاستقرار: فقد بدأ RSI في الارتفاع من منطقة التشبع البيعي، مما يعكس اعتدالًا في زخم الهبوط بعد التراجع الحاد. وتظل قوة الاتجاه مرتفعة، مع قراءات ADX المرتفعة، مما يشير إلى بيئة اتجاه نشطة وناضجة على الرغم من فقدان الزخم الاتجاهي مؤخرًا.
من الناحية الهيكلية، أصبح السعر الآن أقل بكثير من مناطق المقاومة السابقة حول 90,000 و107,000 و114,000 دولار، مما يبرز مدى الحركة السابقة.