비트코인의 최근 하락이 시장 지배력 변화의 신호인 이유

비트코인의 최근 하락은 단순한 가격 하락이 아니라, 시장을 지배하는 주체가 명확히 바뀌고 있음을 보여줍니다. 데이터에 따르면 세계 최대 암호화폐인 비트코인은 10월 고점(12만6천 달러 이상) 대비 40% 넘게 하락했으며, 이번 주 한때 7만3천 달러 아래로 떨어지며 2024년 11월 이후 최저치를 기록했습니다.
특히, 분석가들에 따르면 비트코인은 이제 True Market Mean Price(진정한 시장 평균가) 아래로 내려갔는데, 이는 역사적으로 강세장이 약세장으로 전환되는 분기점으로 여겨지는 평가 기준입니다.
이번 하락은 AI 주도 주식 매도세와 지정학적 긴장 고조로 인해 글로벌 투자자들이 위험자산에서 이탈하는 가운데 발생했습니다. 금은 단일 세션에서 거의 7% 급등했고, 자산군 전반에 걸쳐 변동성이 상승하면서 비트코인의 움직임은 시장 주도권이 매수자에서 매도자로 이동하고 있음을 시사합니다. 이러한 전환은 앞으로 수개월간 가격 흐름에 영향을 미칠 수 있습니다.
비트코인 하락을 이끄는 요인은?
비트코인의 하락은 금융시장 전반의 위험회피 움직임과 함께 전개되었습니다. 미국 주식시장은 인공지능 투자에 대한 신뢰가 약화되면서 하락했고, 나스닥은 1.4% 떨어졌으며 주요 기술주들도 급락했습니다.
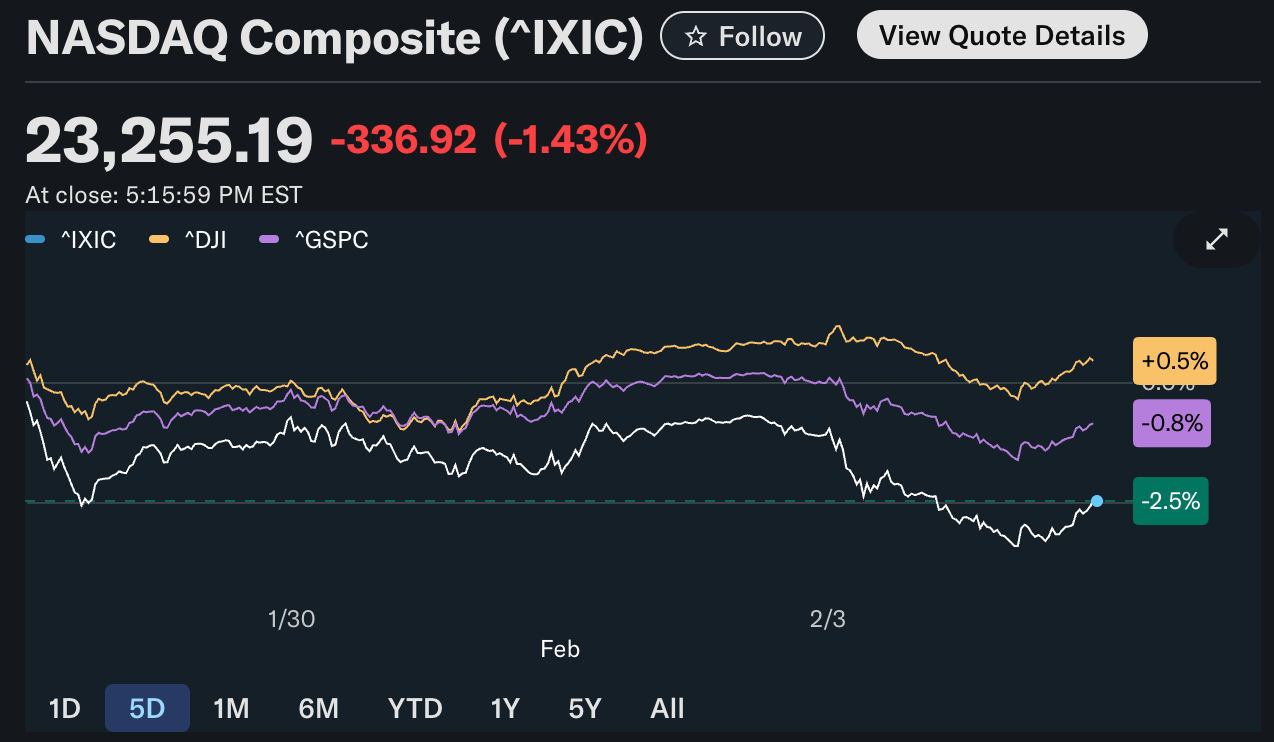
Microsoft의 실망스러운 클라우드 성장과 AI 투자 비용 증가가 맞물리며, 기술 섹터 전반의 밸류에이션이 지속 가능한 이익을 앞질렀다는 우려가 다시 불거졌습니다.
주식이 하락하자, 투기성 자산도 동반 하락했습니다. 비트코인은 헤지 역할보다는 고베타 기술주와 동조해 움직이며 유동성 환경에 민감함을 다시 한 번 보여주었습니다. 투자자들이 위험 노출을 줄일 때, 비트코인은 특히 암호화폐 파생상품 시장에서 레버리지가 높을 때 과도한 손실을 흡수하는 경향이 있습니다.
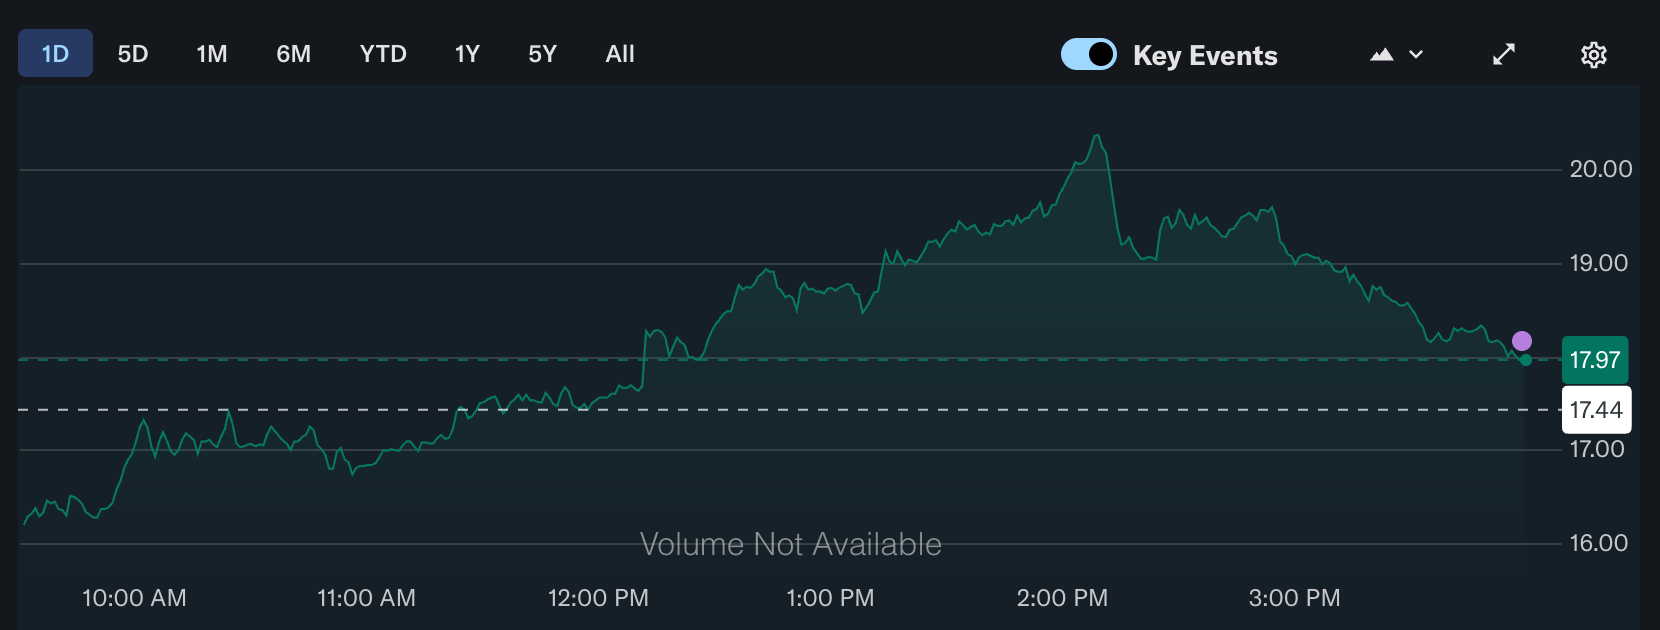
지정학적 이슈도 압박을 가중시켰습니다. 미국이 자국 항공모함 근처에서 이란 드론을 격추했다는 보도가 나오자, VIX 변동성 지수는 한때 20을 넘어서며 시장 스트레스가 고조된 수준을 보였습니다.
자본은 전통적 안전자산으로 빠르게 이동했고, 금과 은은 한 주 동안 두 자릿수 상승률을 기록하며 비트코인은 방어적 포지셔닝에서 소외되었습니다.
중요성: 진정한 시장 평균가 하락의 의미
이번 움직임에서 가장 중요한 신호는 비트코인이 현재 약 8만 달러로 추정되는 True Market Mean Price(진정한 시장 평균가) 아래로 떨어졌다는 점입니다.
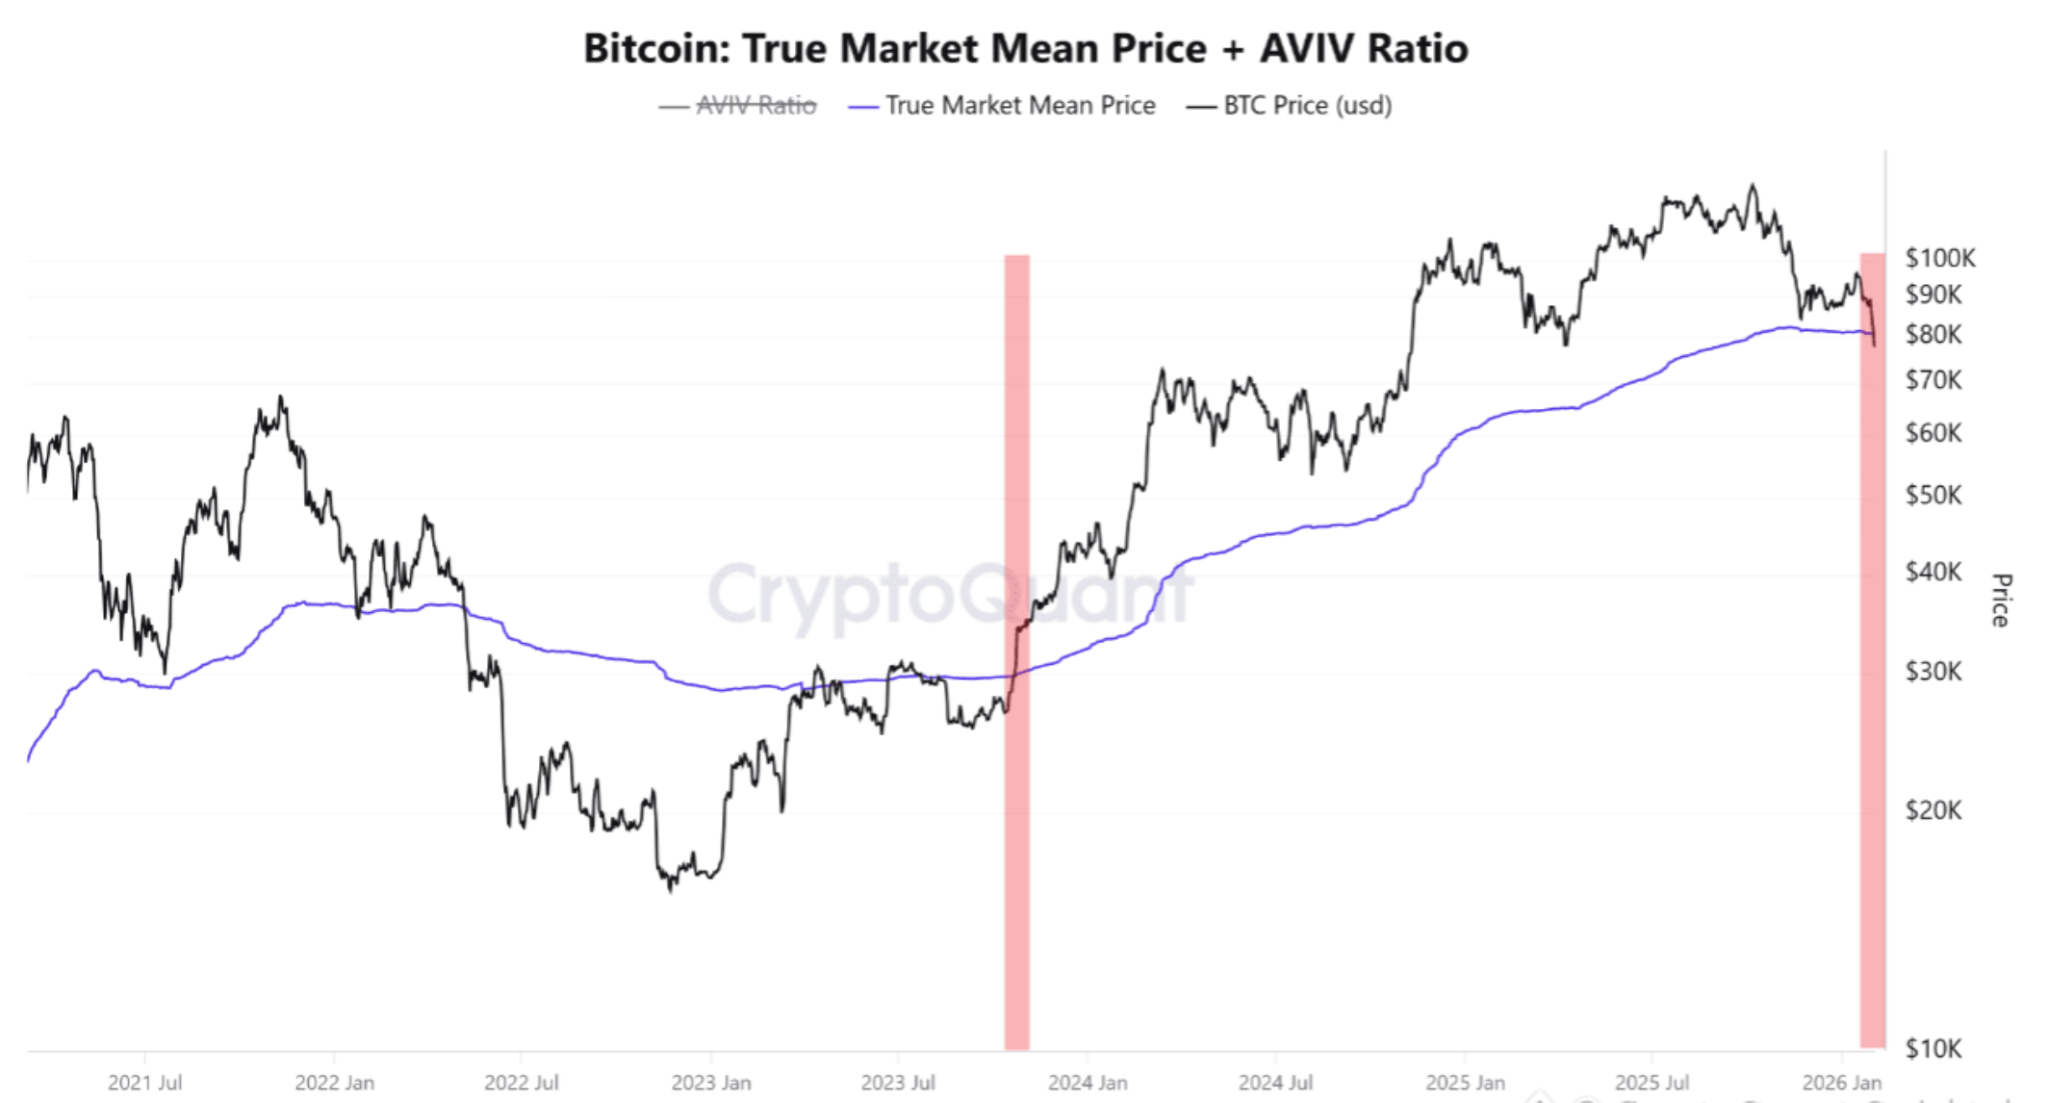
이 지표는 모든 비트코인 보유자의 평균 역사적 매입단가를 반영하며, 대다수 투자자가 이익 또는 손실 상태인지 평가하는 데 널리 사용됩니다. 가격이 이 수준 위에 머물면 매수자가 대체로 주도권을 유지하지만, 이 아래로 떨어지면 매도 압력이 종종 강화됩니다.
과거 사이클에서도 이 변화는 시장 체제의 전환을 의미했습니다. 2022년 하락장에서는 비트코인이 이 지표 아래로 주간 마감한 뒤 7개월간 55% 넘게 추가 하락한 바 있습니다. 현재 상황은 다르지만, 투자자 행동은 유사합니다. 손실을 본 보유자들이 반등 시 매도에 나서며 상승 모멘텀을 제한하는 경향이 있습니다.
Hashdex의 글로벌 시장 인사이트 책임자인 Gerry O’Shea는 비트코인이 금과 괴리되는 현상이 투자자들이 현재 위험을 어떻게 인식하는지 보여준다고 강조했습니다. 금은 지난 5년간 비트코인보다 더 높은 수익률을 기록하며, 거시적 불확실성 시기에 시장이 여전히 검증된 가치 저장 수단을 선호함을 시사합니다. 이러한 선호 변화는 가격 결정권이 누구에게 있는지 평가할 때 중요합니다.
암호화폐 시장 및 투자자에 미치는 영향
즉각적인 영향은 암호화폐 시장 전반에서 확인되고 있습니다. 비트코인의 급격한 일중 하락은 레버리지 포지션의 청산을 촉발해 하락세를 가속화했고, 주요 알트코인들도 동반 하락했습니다. 시장 주도권이 매도자 쪽으로 이동하면, 유동성 부족이 가격 변동성을 증폭시키면서 변동성이 높아지는 경향이 있습니다.
개인 투자자에게는 구조적 영향이 더 큽니다. 많은 투자자들이 2024년 말 랠리 때 진입해, 현재 보유자의 상당수가 미실현 손실을 안고 있습니다. 역사적으로 이는 위험 선호를 낮추고 회복을 지연시키는 요인으로 작용하며, 신뢰 회복에도 시간이 걸립니다. 기관 자금도 더 선별적으로 유입되고 있으며, 현 시점에서는 디지털 자산보다 원자재 및 방어적 자산을 선호하는 경향이 뚜렷합니다.
전문가 전망: 앞으로의 흐름
향후 전망에 대해 분석가들은 비트코인이 새로운 균형점을 찾는 과정에서 변동성이 지속될 것으로 예상합니다. 규제 불확실성, 거시경제 불안정, 금융 여건의 긴축 등은 단기 반등 가능성을 제한합니다. O’Shea는 암호화폐가 기존 금융 인프라에 통합되는 과정에서 단기적 혼란이 이어질 것으로 보지만, 장기적 채택 추세는 여전히 견고하다고 전망합니다.
역사적으로 주요 평가 지표 하락은 빠르게 해소되지 않는 경우가 많았습니다. 대신 시장은 약한 투자자가 이탈하고 강한 보유자가 매집하는 장기 조정 또는 점진적 하락 국면에 진입하는 경향이 있습니다. 향후 3~6개월간 비트코인이 8만 달러 선을 회복할 수 있을지 여부가 매수자가 주도권을 되찾을지, 아니면 매도자 우위가 지속될지 가늠하는 신호가 될 것입니다.
핵심 요약
비트코인의 최근 하락은 단기적 약세를 넘어, 시장 주도권이 매수자에서 매도자로 이동하고 있음을 시사합니다. 글로벌 시장 전반의 위험 선호가 약화되면서, 암호화폐는 헤지 수단이 아닌 투기적 자산의 성격을 더 강하게 보이고 있습니다. 앞으로 몇 달간 이 움직임이 장기 조정으로 이어질지, 아니면 회복의 기반이 될지 결정될 전망입니다. 당분간은 인내와 위험 관리가 무엇보다 중요합니다.
비트코인 기술적 전망
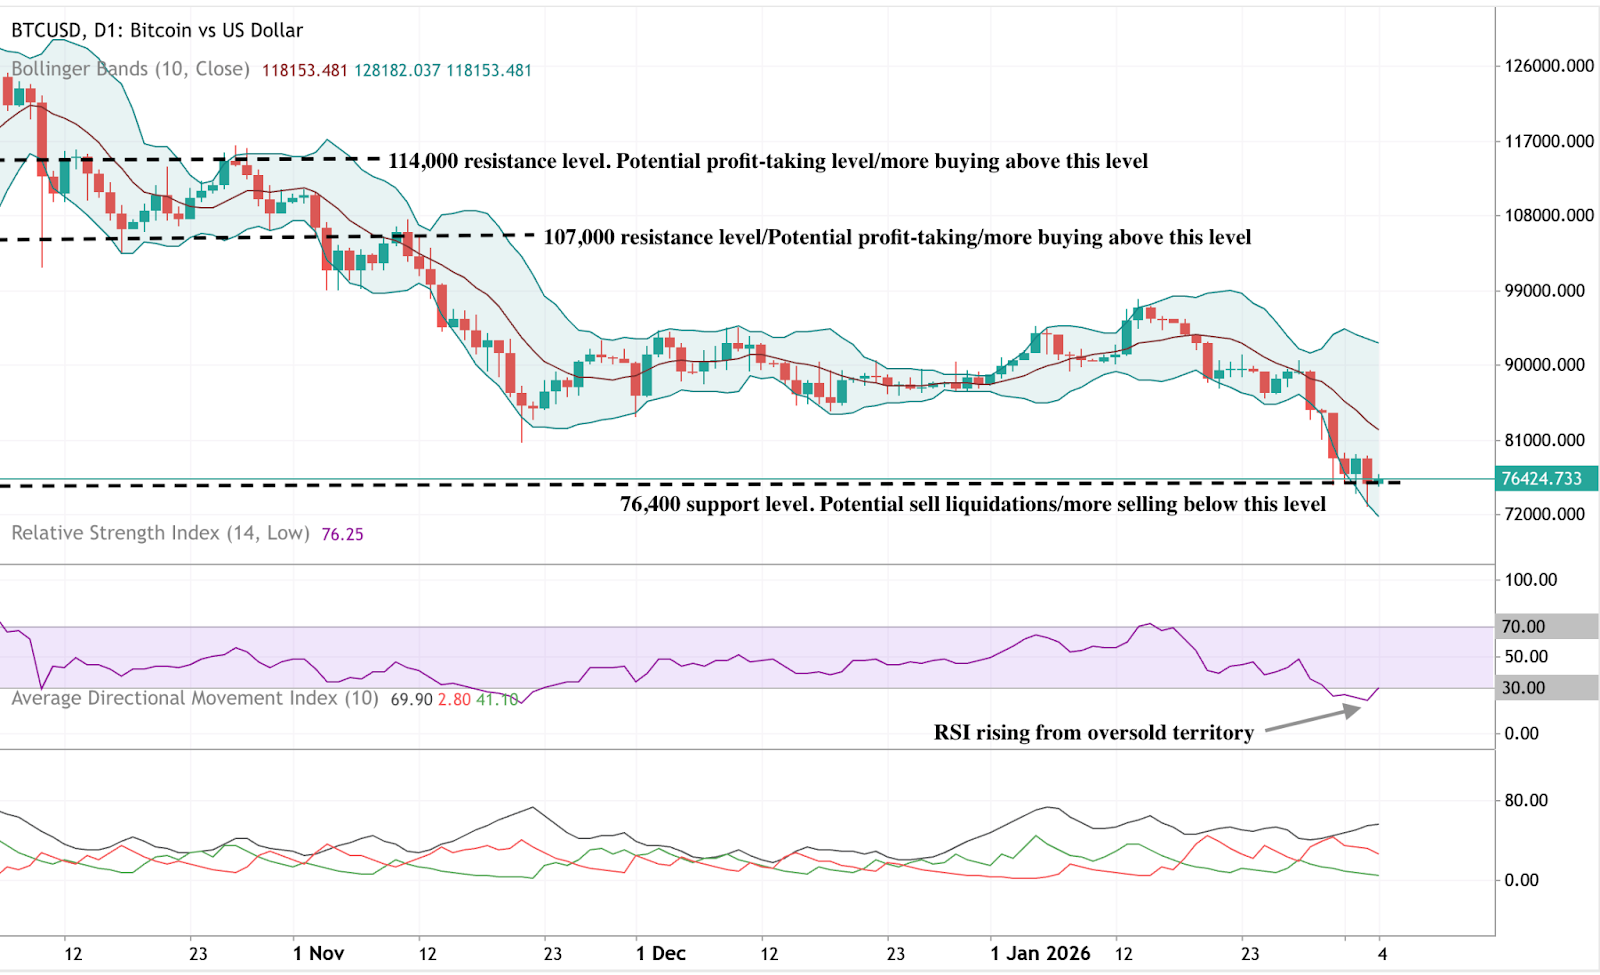
비트코인은 전체 구조 내에서 하락세를 이어가고 있으며, 가격은 하단 Bollinger Band 아래로 내려갔다가 7만6,400달러 부근에서 안정세를 보이고 있습니다. Bollinger Bands는 여전히 크게 확장되어 있어 최근 하락 가속 이후 변동성이 여전히 높음을 나타냅니다.
모멘텀 지표는 안정화 초기 신호를 보여주고 있습니다. RSI는 과매도 구간에서 상승세로 전환되며, 급락 이후 하락 모멘텀의 완화를 반영합니다. 추세 강도는 여전히 높으며, ADX 수치도 상승해 최근 방향성 상실에도 불구하고 활발하고 성숙한 추세 환경임을 시사합니다.
구조적으로 가격은 현재 9만 달러, 10만7천 달러, 11만4천 달러 부근의 이전 저항 구간보다 훨씬 아래에 위치해, 이전 하락폭의 크기를 부각시킵니다.