Japan’s Bond market decline is a cautionary tale for the US

Note: As of August 2025, we no longer offer the Deriv X platform.
Reports say Japan’s bond market isn’t just having a wobble - it’s in the midst of a full-blown reckoning. Yields are climbing, losses are mounting, and the central bank’s balance sheet is buckling under the weight of decades of easy money. For years, Japan was the textbook case of low rates and high debt without consequence. But now, the consequences are catching up. If Japan’s debt story feels distant, the US shouldn’t get too comfortable. The cracks in Tokyo may well be a preview of what’s going to Washington.
Government debt-to-GDP ratio: Fortresses no more
The 30-year Japanese government bond yield hit 3.209% in mid-July - the highest in years - marking a 100 basis point surge in just 12 months.
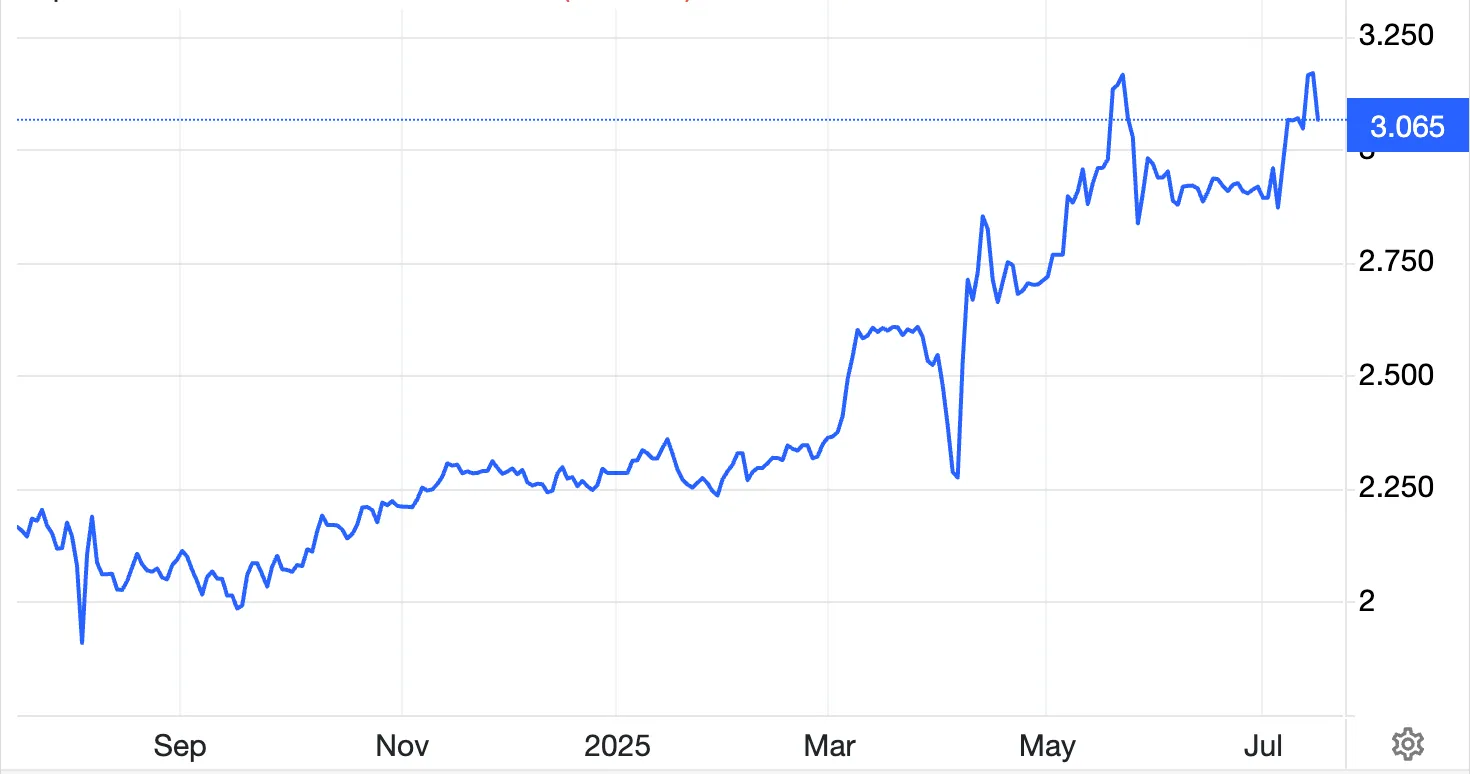
On the surface, that’s just a number. But beneath it lies something deeper: a 45% drop in bond value since 2019. This isn’t just a slide - it’s a collapse.
Japan’s bond market was once the gold standard of safety. But that status is slipping as investors grow uneasy about the country’s mounting debt burden, and more importantly, the Bank of Japan’s (BOJ) ability to manage it.
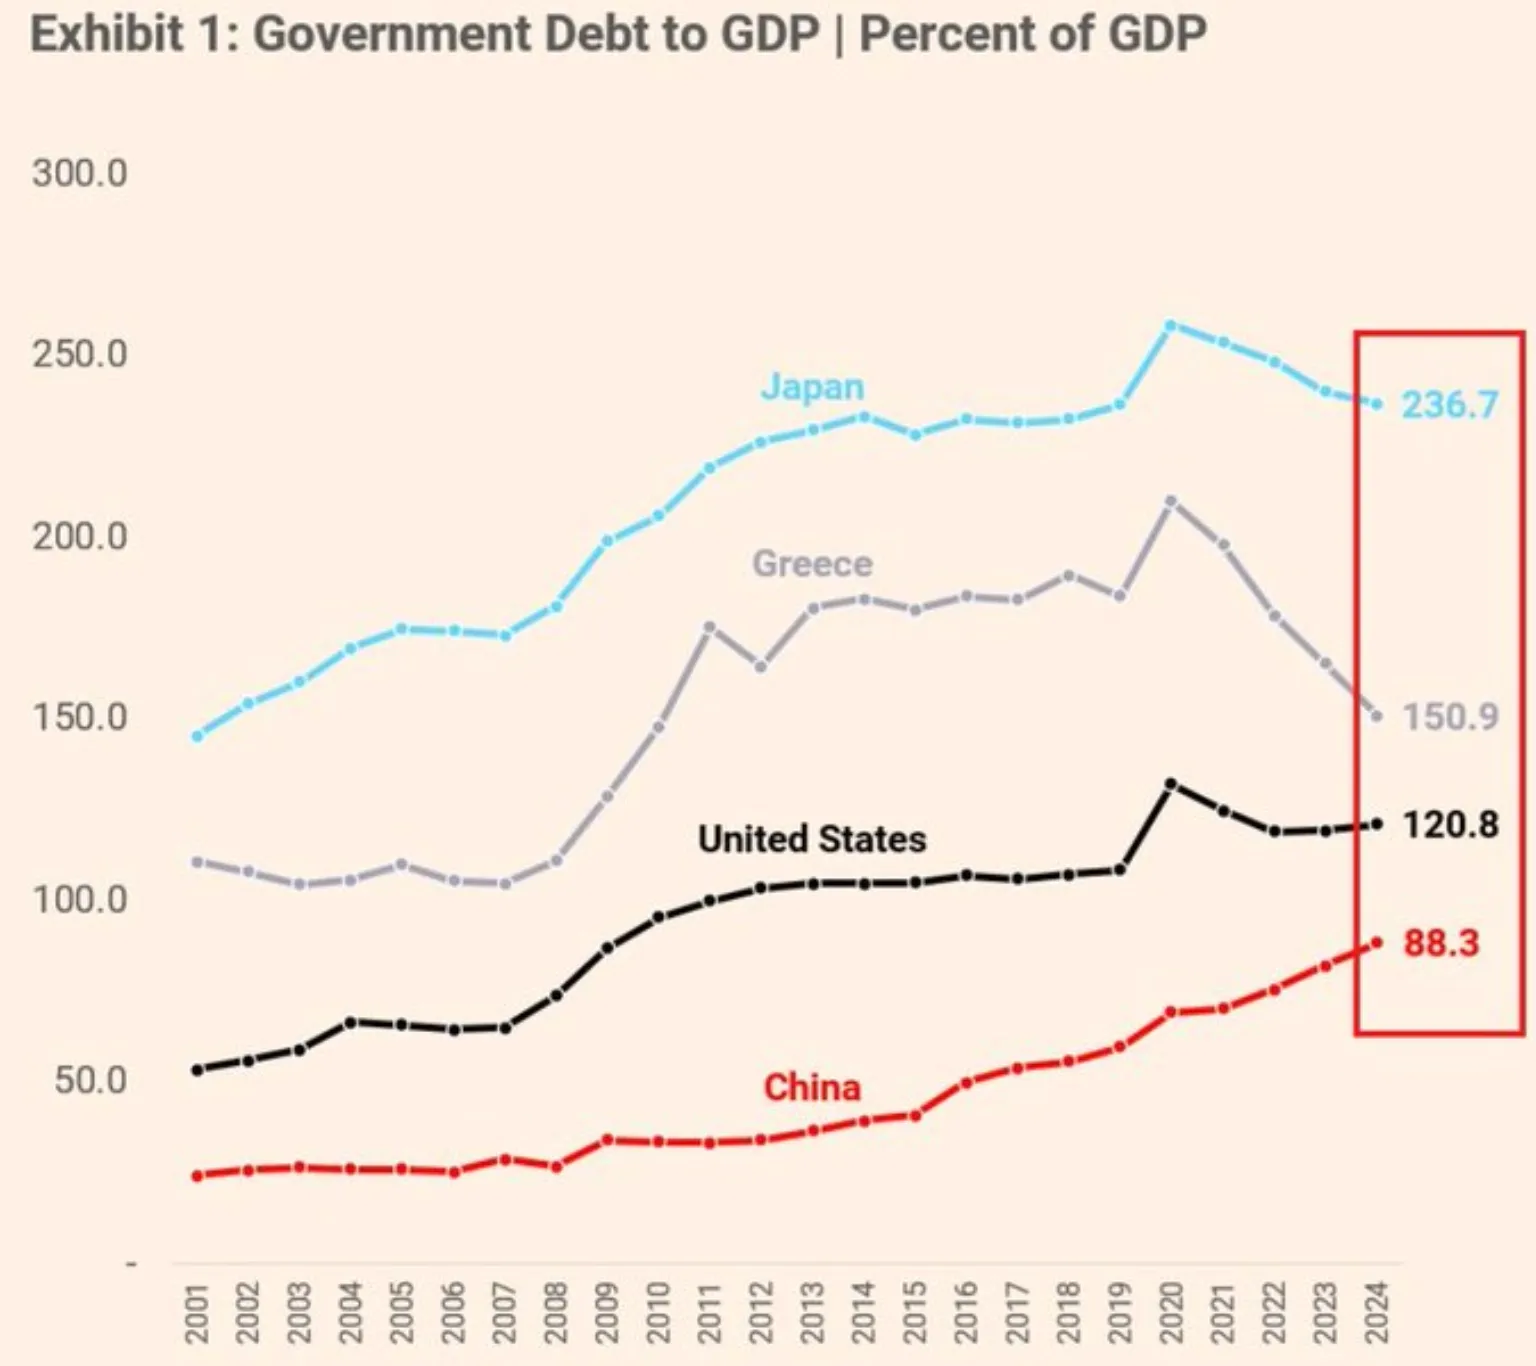
With a debt-to-GDP ratio now exceeding 260%, more than double that of the United States, Japan’s fiscal house is looking shakier by the day.
Bank of Japan bond losses: The cost of confidence
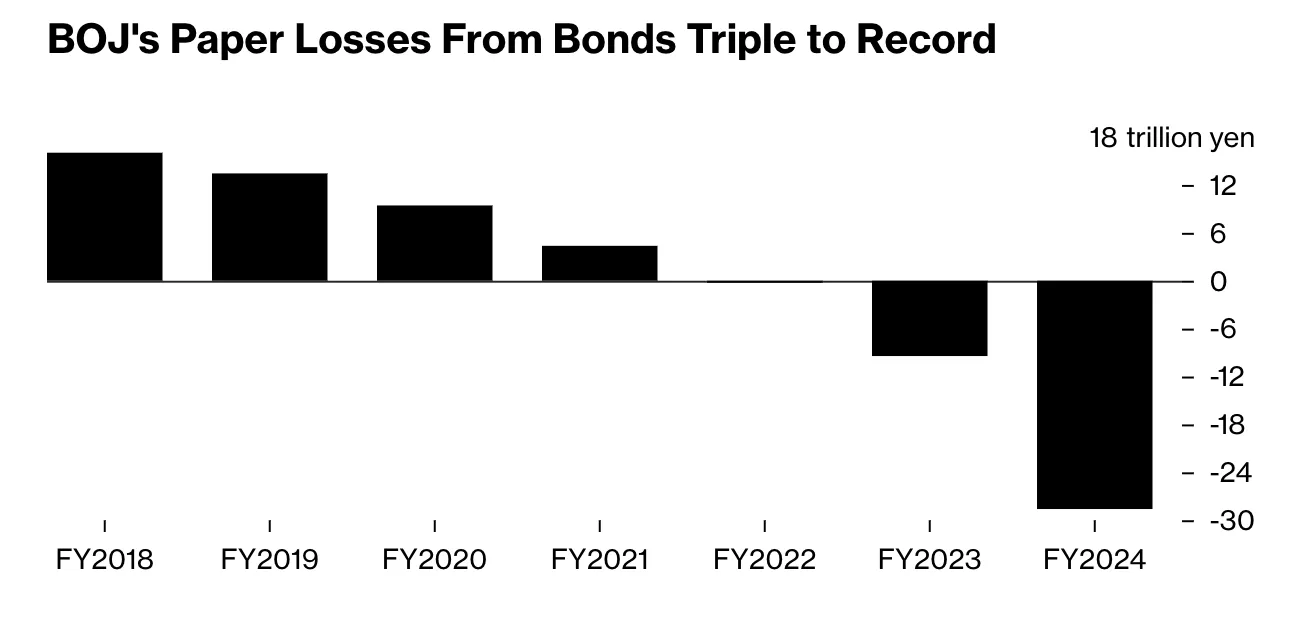
The Bank of Japan, once a guardian of market stability, is now sitting on a record ¥198 trillion (about $198 billion) in unrealised losses on government bonds - a threefold increase in just one year. That’s not just a paper cut. It’s a gaping wound.
The fallout doesn’t stop there. Japan’s largest life insurers, long-time holders of government debt, reported a combined ¥60 billion in unrealised losses in Q1 2025 alone - quadruple what they held just a year earlier. Rising yields are rippling through the financial system, quietly eroding balance sheets and tightening liquidity.
Perhaps most telling of all: over 52% of all Japanese government bonds are now owned by the BOJ itself. When the buyer of last resort becomes the primary holder, the system starts to look eerily self-referential - and dangerously fragile.
A debt playbook the world knows well
Japan’s economic story is unique in many ways - a rapidly ageing population, a deflationary mindset, and a penchant for long-term planning. But its playbook - low interest rates, heavy bond-buying, and ballooning public debt - is anything but isolated.
In fact, it’s starting to sound rather familiar. In the United States, 10-year Treasury yields have surged over 500% since 2020.
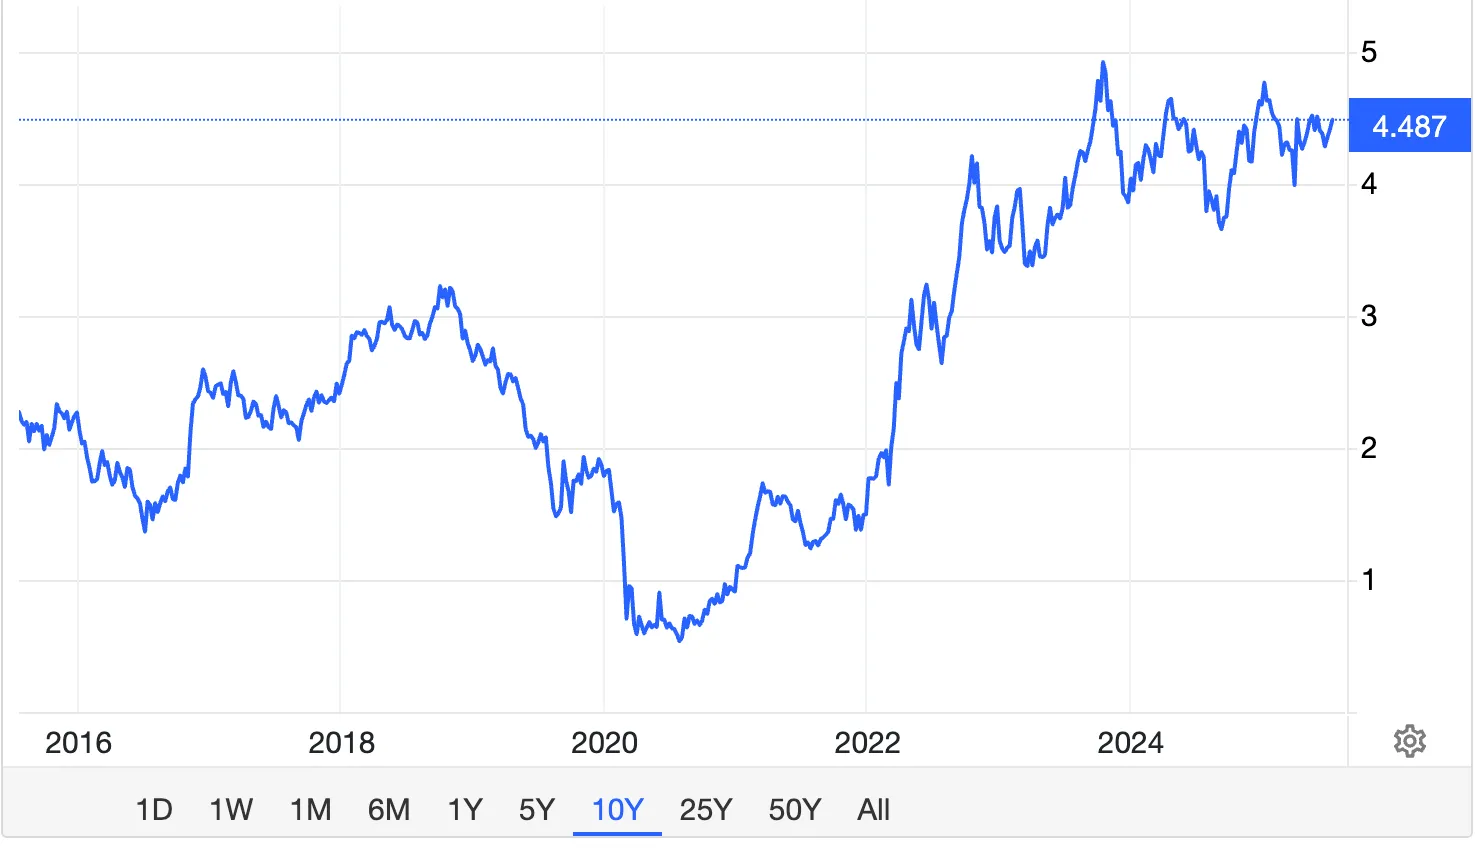
Banks are shouldering more than $500 billion in unrealised bond losses. Deficit spending is accelerating. And central bank balance sheets are still bloated from years of stimulus. While the US hasn’t reached Japan’s 260% debt-to-GDP, it’s moving fast - and with fewer excuses.
Global bond market liquidity
What’s happening in Japan isn’t just about Japan. It’s a signal of what happens when confidence starts to slip - when the promise that governments can always repay their debts no longer feels like a sure bet.
Market liquidity is drying up. Bloomberg’s Government Bond Liquidity Index has dropped below levels seen during the 2008 crisis, and investors are taking note. Gold and Bitcoin are surging, not just on speculation but on fear that the rules of the old monetary system might be fraying.
This moment also challenges long-held beliefs. For decades, economists insisted that high debt levels were manageable as long as interest rates stayed low. But Japan has kept its policy rate at 0.50%, and still faces bond yields around 3.1%, on par with Germany, whose debt load is just a fraction. That disconnect suggests something more profound is at play: trust is eroding.
The message markets are sending
Japan’s bond market is offering the world a lesson in real time - one that policymakers and investors would do well to study. A country can carry high debt and low rates for a long time… until it can’t. Once yields rise, the feedback loop kicks in: losses mount, confidence erodes, and liquidity evaporates.
The real warning for economies like the US isn’t just in the numbers - it’s in the trajectory. The very tools that kept systems afloat - such as bond purchases, ultra-low rates, and fiscal expansion- may now be amplifying the risks. And unlike in the past, there’s no clean exit.
USDJPY price outlook
According to experts, Japan’s bond market decline isn’t an isolated incident or a temporary blip. It’s a stress test for the global financial order - and it’s revealing just how fragile that order might be. As the world’s second-largest bondholder starts to buckle, others should take note.
This isn’t about panic. It’s about preparation. Because if Japan’s reckoning has begun, the real question isn’t whether the US and others will face one too, but when. Meanwhile, the USDJPY pair continues to climb, reflecting investor jitters and the widening gap between US and Japanese bond yields.
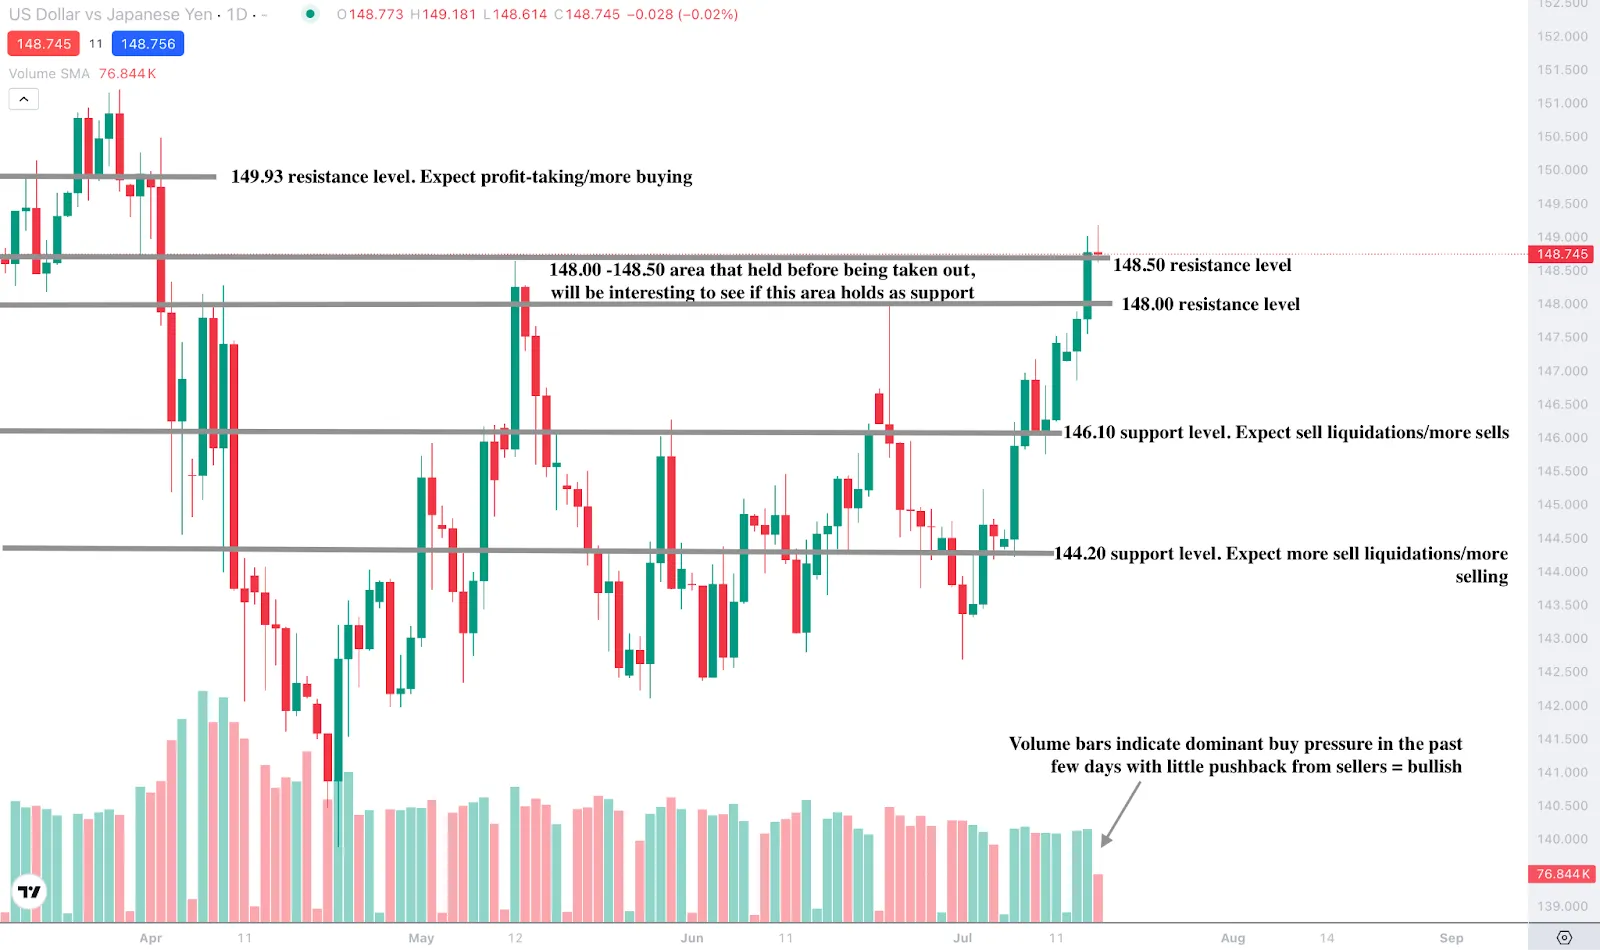
At the time of writing, the pair is still quite bullish with price coming out of a 4-month consolidation. The volume bars indicate that sellers have barely offered any pushback over the past few days, hinting at a pathway to more upside for the pair. If we see more upside, prices could encounter resistance at the 149.93 resistance level. Conversely, if we see a slump, prices could find support floors at the 146.100 and 144.200 support levels.
Disclaimer:
The performance figures quoted are not a guarantee of future performance.


