Gold and Silver price forecast: What’s next after breaking key levels?

Gold is back in the spotlight after smashing through $3,120! But this isn’t just another price movement-it’s a major signal about what’s coming next. Between Trump’s tariff threats, growing recession fears, and geopolitical chaos, we’ve got the perfect storm for gold.
But this isn’t just a short-term story-here’s what the road ahead could look like.
The tariff tsunami is pushing Gold higher
Trump is back with his favorite economic weapon-tariffs. His latest proposal? A massive 25% tariff on all foreign cars. That news alone sent markets into a frenzy. But now, the Wall Street Journal is reporting that he’s considering even broader tariffs against multiple countries. Investors don’t like uncertainty, and when things start looking shaky, they run to gold. And that’s exactly what’s happening.
Longer-term, if trade tensions continue to escalate, we could see persistent demand for gold as a hedge. Historically, prolonged trade wars weaken global economic confidence, and gold tends to shine brightest when investors lose faith in traditional markets.
Fear is driving this Gold rally
Gold doesn’t just move randomly. It feeds on fear. And right now, fear is in the driver’s seat. Inflation worries, economic slowdown concerns, and rising global tensions are all making investors nervous. When uncertainty spikes, gold thrives.
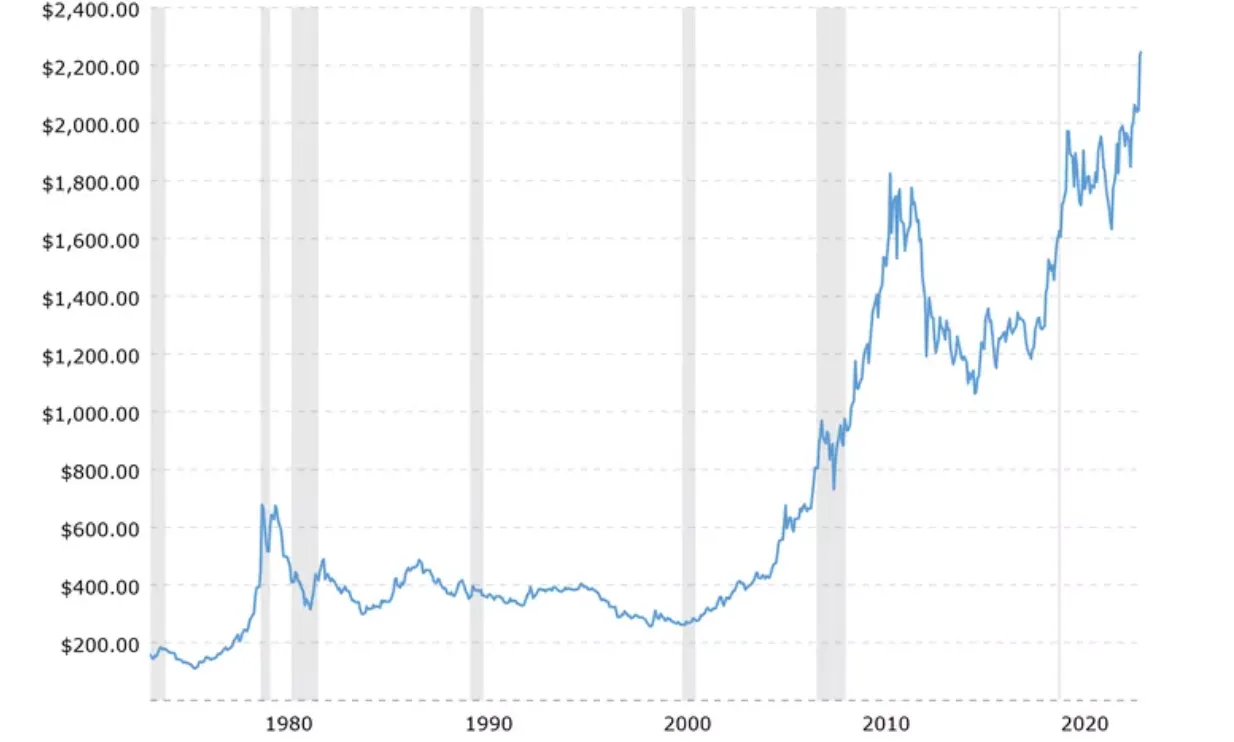
The chart below shows the price of one ounce of gold since 1974. As you can see, the price has had several large swings over the last few decades, where gold spiked in times of uncertainty.
Trump’s latest comments over the weekend didn’t help calm things down, either. He lashed out at Putin, hinted at massive tariffs on Russian oil, warned about potential strikes in Iran, and even put Ukraine’s president on notice. The markets hate unpredictability, and investors are hedging their bets with-you guessed it-gold.
As long as geopolitical risks remain elevated, gold is likely to maintain strong demand. Analysts have pointed out that if global tensions worsen, we could see gold comfortably pushing past $3,500 over the third quarter of this year.
The Fed is stuck, and that’s great for Gold
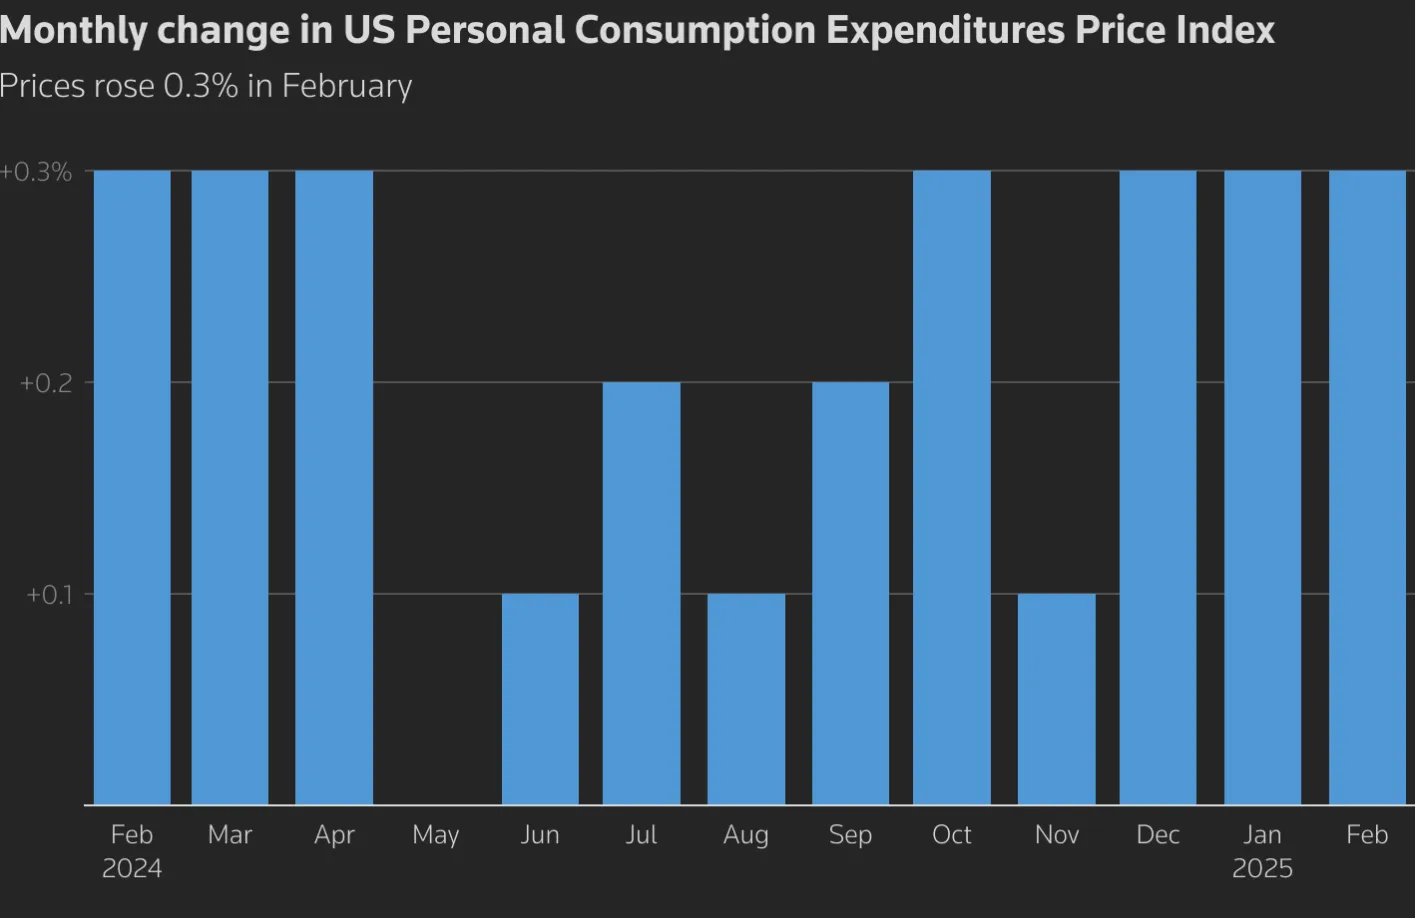
As if the global drama wasn’t enough, the Federal Reserve is now stuck in a tough spot. The latest inflation data showed that the PCE Price Index rose 0.3% in February, with core inflation jumping 0.4%-its biggest gain in months. That’s a recipe for stagflation fears to take off.
The U.S. dollar, meanwhile, is on its third straight day of declines. Why? Because markets now expect the Fed to cut interest rates sooner than later, despite inflation being stubbornly high. A weaker dollar makes gold even more attractive, and traders are taking full advantage.
According to analysts, the Fed’s next moves will be crucial. If rate cuts happen while inflation remains sticky, gold could enter a long-term uptrend. Many traders are already eyeing $4,000 gold as a real possibility within the next 12-18 months.
Silver is the real sleeper hit
Gold might be stealing the headlines, but silver is quietly staging an even more exciting move. The metal just hit $34.46 before settling at $34.18-and what’s happening behind the scenes is unlike any silver rally in recent memory.
This time around, retail traders aren’t the ones fueling the rally. Instead, institutional buyers-including central banks-are quietly accumulating silver while everyday investors sit on the sidelines. And history tells us that when silver breaks key resistance levels with almost no selling pressure above, things can escalate fast.
The geopolitical backdrop is adding fuel to silver’s fire. April 2nd, dubbed “U.S. Liberation Day,” is expected to bring major tariff announcements from Trump. That means more economic uncertainty-and more demand for precious metals.
But silver isn’t just riding the same wave as gold. It’s uniquely positioned because of its dual role as both a monetary and industrial metal. While gold is mostly seen as a safe haven, silver also has strong demand from industries like tech and renewable energy. And supply? It’s been in deficit for years. That’s a bullish setup if there ever was one.
The perfect storm for precious metals
Between tariffs, inflation, a weakening dollar, and growing market anxiety, gold and silver have everything they need for a sustained rally. And if history is any guide, retail investors will only start piling in after the biggest gains are already made.
With the jobs report coming this Friday, another weak economic number could be the final push for gold to break $3,200-or even higher. And silver? The last time it hit a rare technical condition like this, it tripled in value.
While short-term moves will be dictated by upcoming economic data and political developments, the broader trend for gold and silver remains firmly bullish. Persistent geopolitical tensions, potential Fed rate cuts, and a growing preference for safe-haven assets all point to continued upside.
If trade wars intensify and inflation remains sticky, gold could push toward $4,000 in the coming years, while silver-given its supply constraints and industrial demand-might finally break past $50, or even test all-time highs.
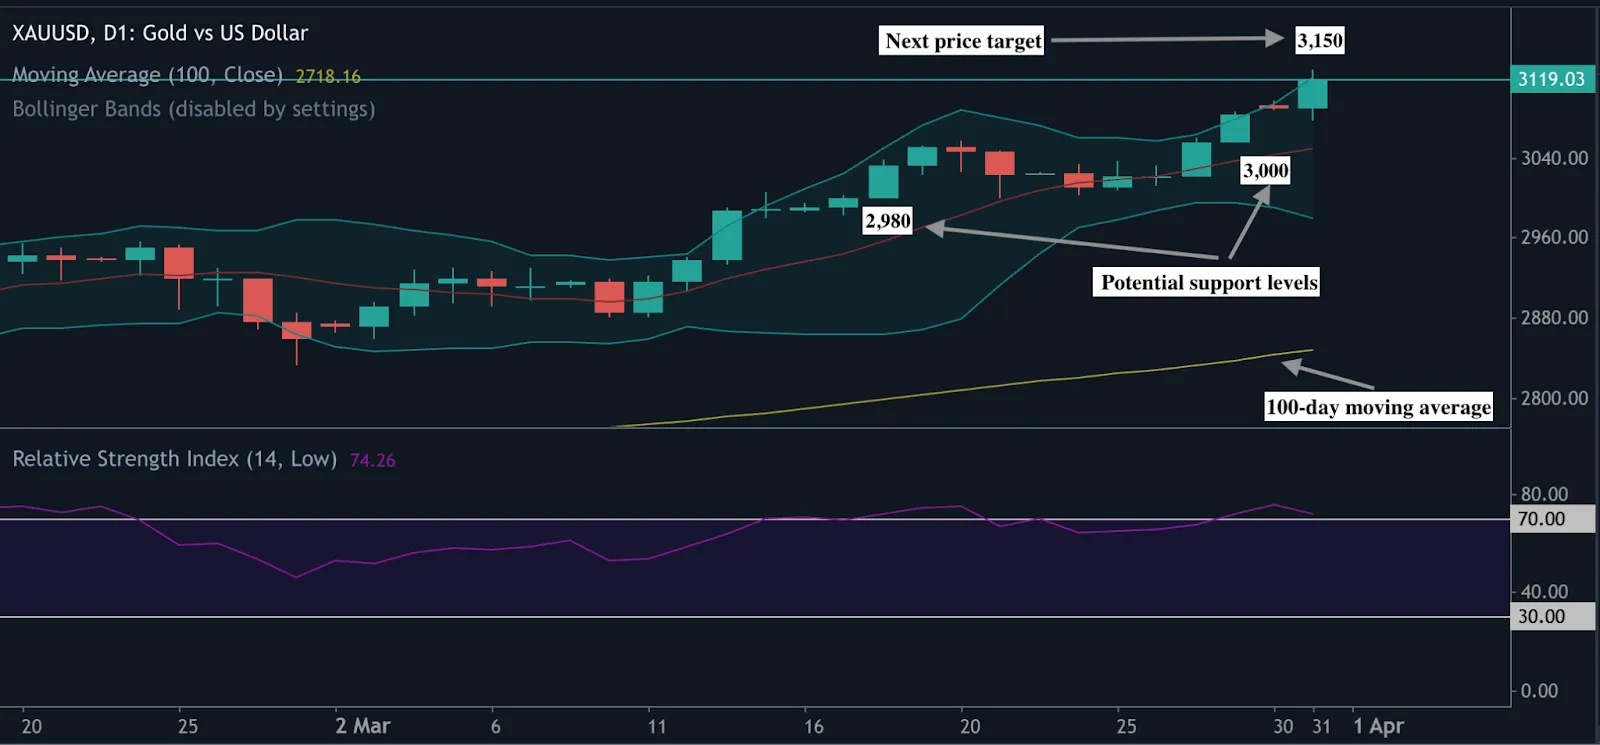
At the time of writing Gold remains on a tear even after smashing the $3,100 target mark. Upward bias persists as $3,150 looks like the next likely target for bulls. The upward narrative is supported by prices remaining above the 100-day moving average. However, prices touching the upper bollinger band hints at overbought conditions. Should we see a reversal due to overbought conditions, the key support levels to watch are $3,000 and $2,980.
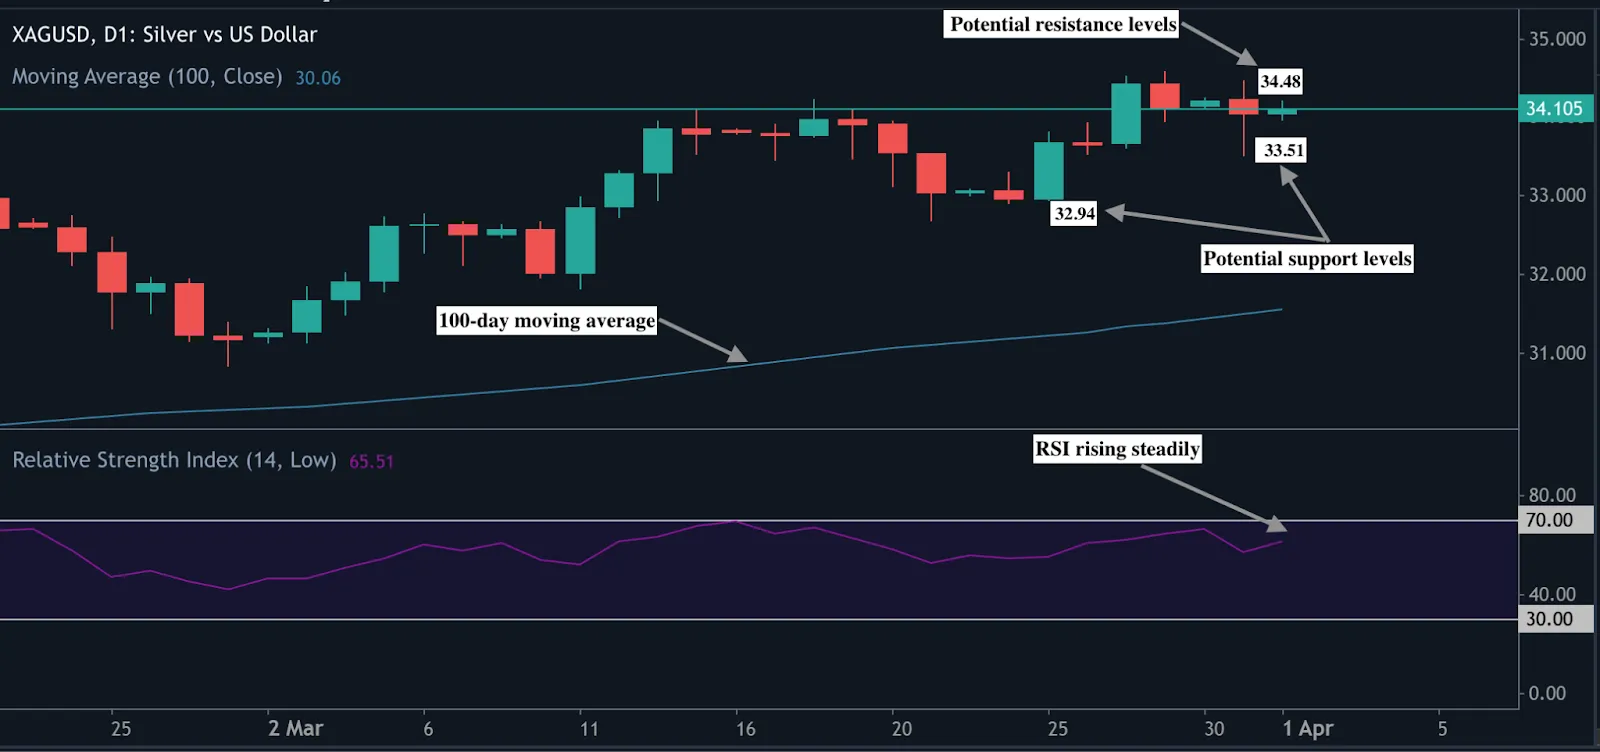
At the time of writing, Silver is seeing some upward pressure which is supported by prices staying above the 100-day moving average. RSI steadily rising towards 70 also adds to the bullish narrative. Key levels to watch should prices continue rising are $34.48, enroute to $35.00. Should the industrial metal see a slide, prices could find support at the $33.51 and $32.94 support levels.
You can get involved and speculate on the price of these two precious metals with a Deriv MT5 account or a Deriv X account.
Disclaimer:
The information contained within this blog article is for educational purposes only and is not intended as financial or investment advice.
This information is considered accurate and correct at the date of publication. No representation or warranty is given as to the accuracy or completeness of this information.
The performance figures quoted are not a guarantee of future performance or a reliable guide to future performance. Changes in circumstances after the time of publication may impact the accuracy of the information.
Trading is risky. We recommend you do your own research before making any trading decisions.
Trading conditions, products, and platforms may differ depending on your country of residence. For more information, visit https://deriv.com/


