Bitcoin price hits 122K amid short squeeze murmurs

Bitcoin just passed $122k, and the crypto crowd is buzzing. While bulls celebrate the breakout, a new narrative is gaining steam: a potential short squeeze could fuel the fire. With Ether shorts hitting record highs and macro uncertainty still swirling, this rally might be running on more than just momentum.
Is this the start of something bigger - or are the bears about to get burned?
Two key dates changed everything
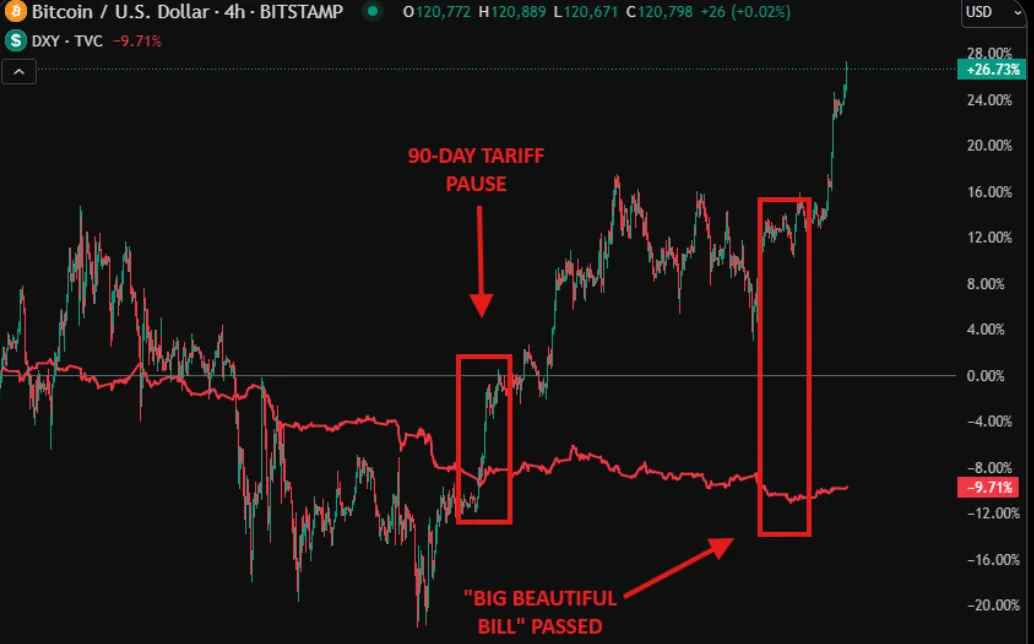
If you zoom out, Bitcoin’s recent moves weren’t random. Two major U.S. policy moments -9 April and 1 July - appear to have kicked off this latest wave of price action. The first was the 90-day tariff pause, which signalled potential monetary easing.
The second is the passing of the “Big Beautiful Bill," a fiscal bombshell projected to cut federal revenue by $5 trillion over a decade. Both events coincided with clear divergences on the charts - Bitcoin surged while the U.S. Dollar Index ($DXY) slipped hard. In fact, the dollar has dropped 11% in just six months. Traders and institutions took the hint.
From spending spree to crypto rally
May 2025 delivered one of the most eye-watering figures yet: a $316 billion U.S. deficit in a single month - the third-largest in history, according to the Congressional Budget Office.
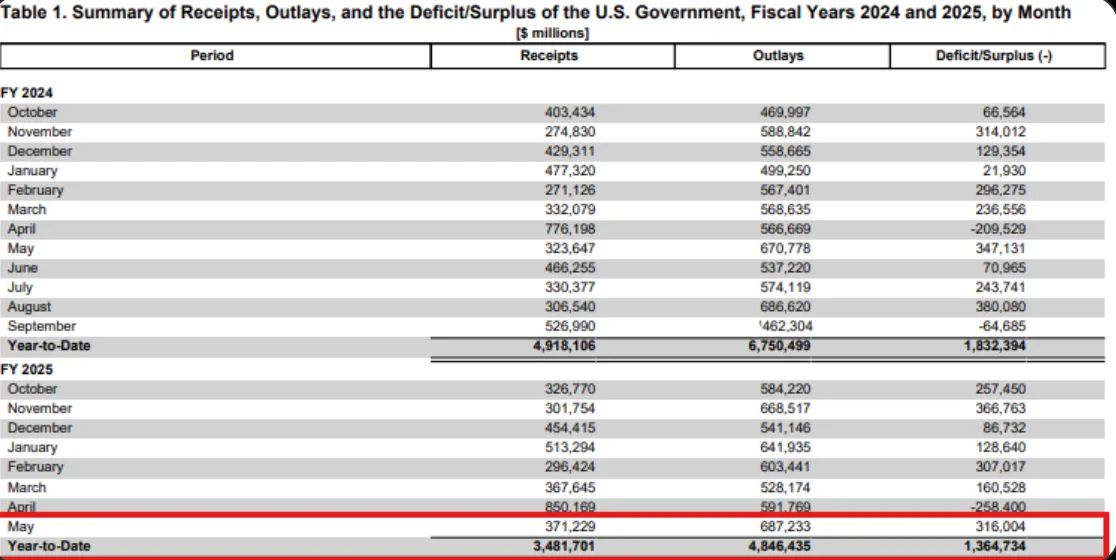
Add in the looming projections of a $1.9 trillion full-year deficit, and markets are now firmly pricing in long-term fiscal strain. Bitcoin isn’t just reacting to hype anymore. It’s starting to act like a macro barometer - a hedge against reckless spending and weakening fiat credibility. And the market’s behaviour reflects that: as the U.S. deficit deepens, Bitcoin’s price keeps climbing.
Eyes on Bitcoin ETFs: Institutions are quietly all in
This rally isn’t retail-driven. It’s institutional. The iShares Bitcoin ETF ($IBIT) has amassed a jaw-dropping $76 billion in assets under management, and it did it in less than 350 days. For context, gold’s flagship ETF ($GLD) took 15 years to hit the same milestone.
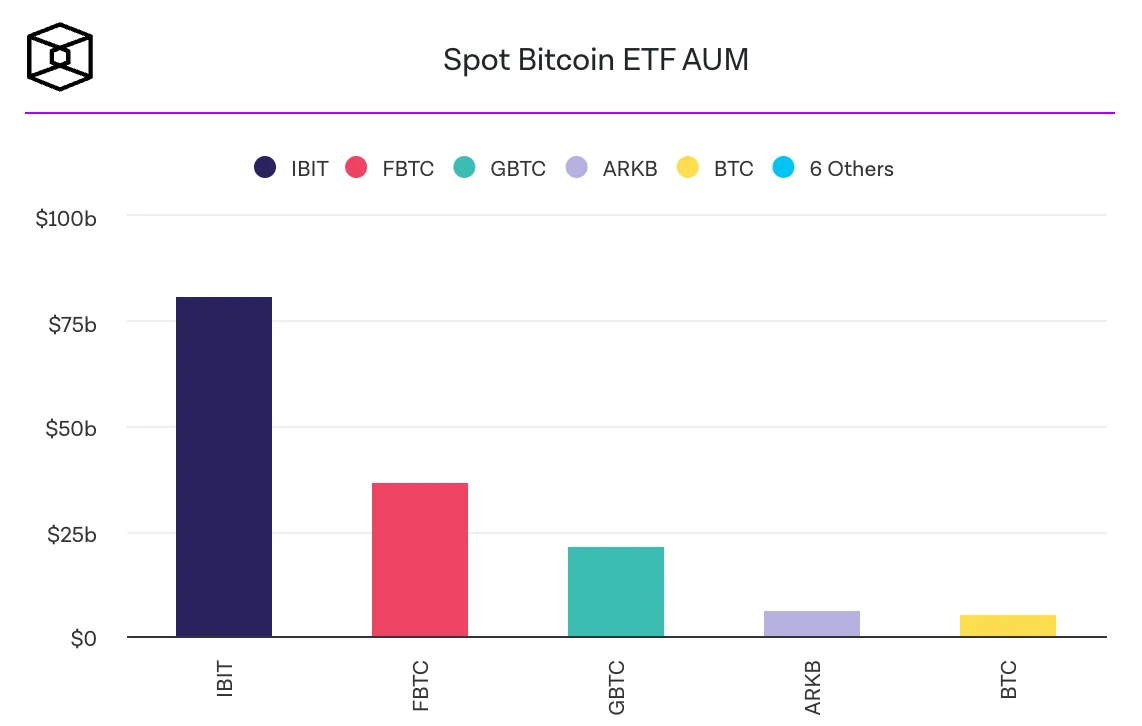
That shift isn’t just symbolic - it’s structural. Hedge funds and family offices are reportedly allocating around 1% of their portfolios to Bitcoin. They’re not doing it for fun - they’re doing it because Bitcoin is behaving like an escape hatch in an increasingly uncertain environment.
Shorts could be the final fuel
Then there’s Ether. According to recent data (via ZeroHedge), leverage shorts on Ether have hit all-time highs - a setup eerily similar to what we saw right before the April 2025 bottom. If a squeeze happens there, Bitcoin could ride the wave even higher.
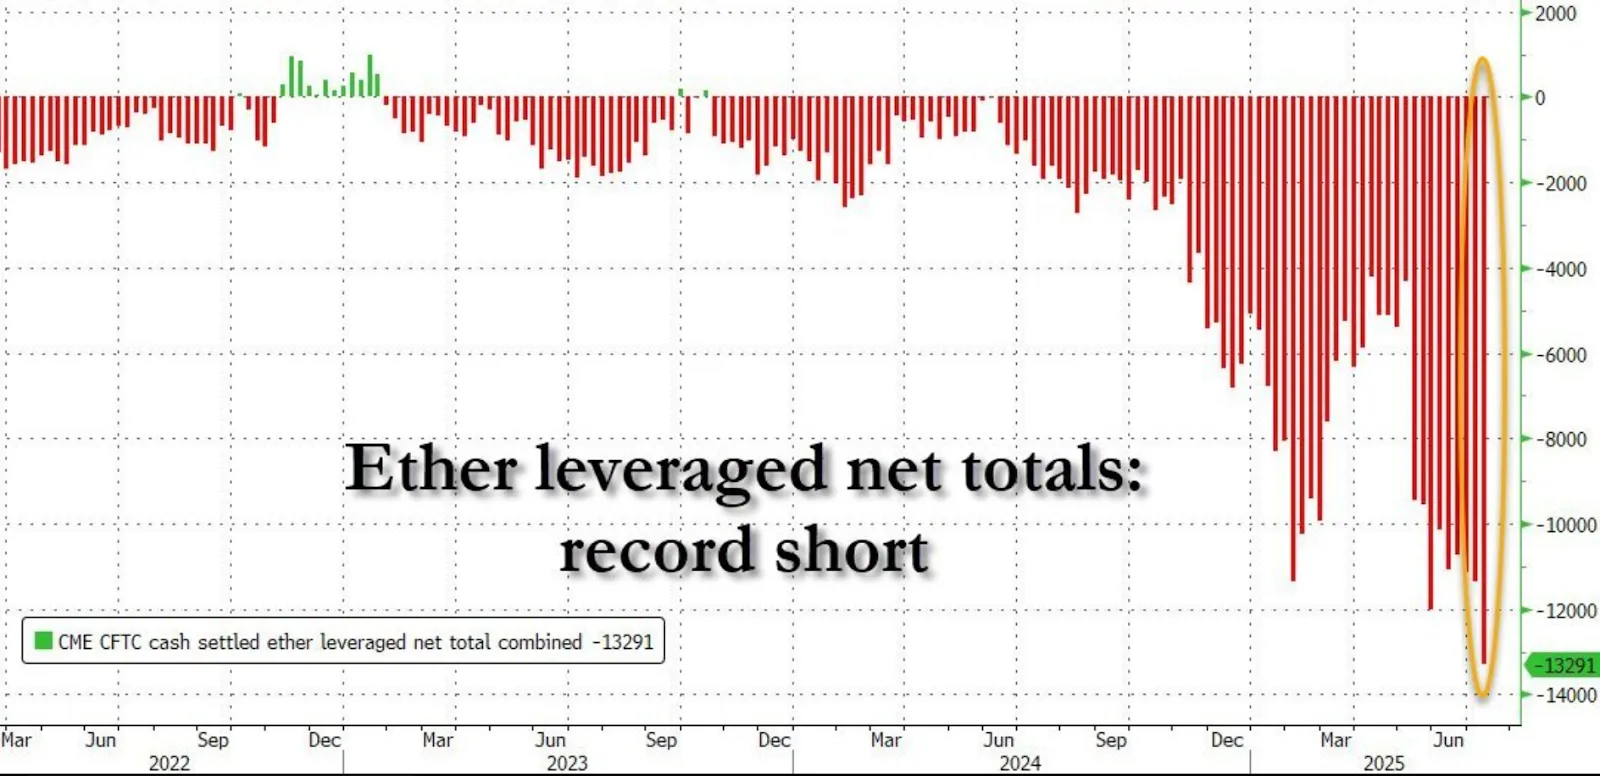
In other words, this isn’t just a story of long-term fundamentals. There’s potential firepower on the short side, too. A few liquidation cascades could turn a healthy rally into an all-out melt-up.
Bitcoin price outlook: Is Bitcoin the new normal?
Traditional safe havens like gold are rising. The dollar is falling. Yields are rising. And Bitcoin? It’s surging. These aren’t disconnected events - they’re all part of the same economic puzzle.
Bitcoin’s role is evolving. It’s not just a tech bet or an inflation hedge. It’s becoming a reaction to policy, to debt, deficits, and the sense that nobody’s steering the ship. Whether this ends in a squeeze, a supercycle, or something else entirely, one thing’s clear:
Markets are no longer ignoring Bitcoin. And neither should you.
At the time of writing, BTC is still soaring towards new highs. A wick is forming at the top, a telltale sign of seller pushback. However, the volume indicates that sell pressure has yet to manifest with conviction - an indicator that we could see more upside before the uptrend experiences exhaustion. If we see an uptick, prices could encounter resistance at the $123,275 price level. If we see a crash, prices could find support at the $108,000 and $105,000 support levels.

Disclaimer:
The performance figures quoted are not a guarantee of future performance. This content is not intended for EU residents.


